
Thin film coatings are thin layers of material, typically ranging from a few nanometers to a few micrometers in thickness, deposited onto a substrate. Thin films are used in a wide range of applications such as electronics, solar cells, optical coatings, and packaging, to name a few. Their performance is strongly dependent on properties like composition, uniformity, surface roughness, or thickness. Therefore, quality control (QC) is essential to ensure that performance, reliability, and consistency of these films match the application requirements. Hyperspectral imaging (HSI), in comparison to traditional quality control techniques such as ellipsometry, profilometry or X-ray diffraction (XRD), offers a non-contact, non-destructive, and rapid assessment of thin film properties with high spatial resolution based on spectroscopic information.
To demonstrate the capabilities of HSI for thin film QC we will look at a set of seven TiO2 coated PEN polymer substrate samples (3x3cm) with nominal coating thicknesses varying between 9.6 and 42.3 nm. The goal of this study will be to use supervised machine learning on the spectroscopic information of the thin film coatings to predict their thickness. The samples are shown in Figure 1, color-coded and labeled with ground truth thicknesses obtained by ellipsometry (on reference silicon substrate samples). These values were measured in one location only and do not take intra-sample thickness variation and inhomogeneity into account.
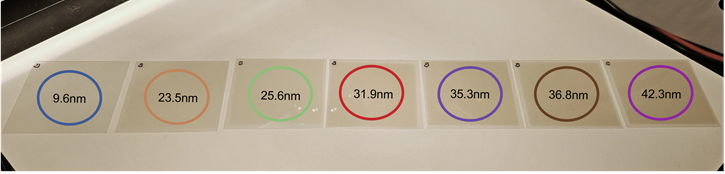
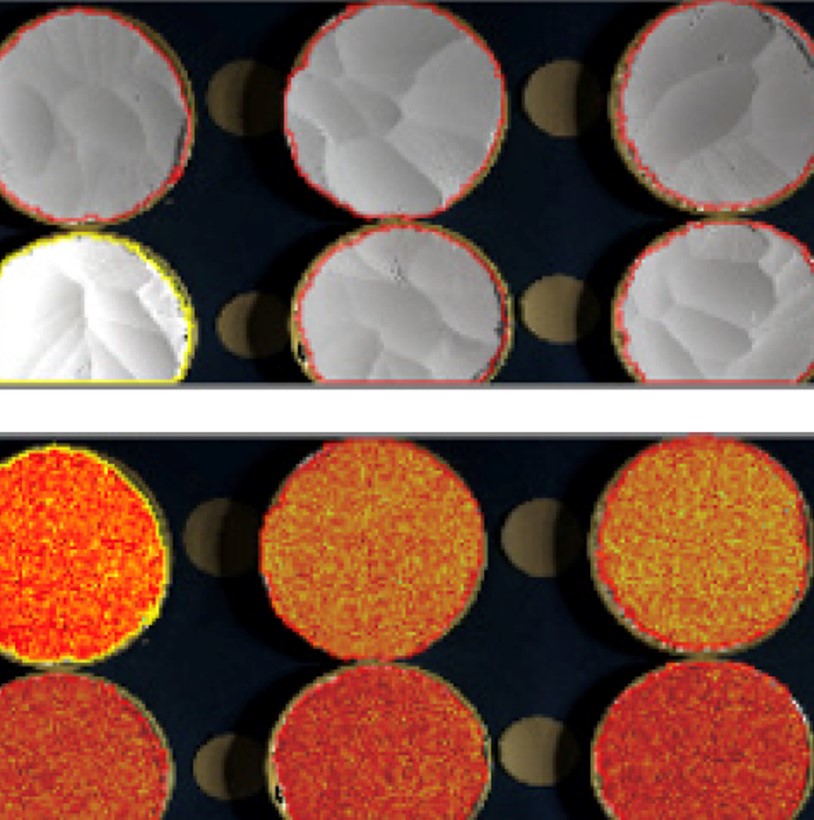
Figure 1. RGB image of the TiO2 thin film samples. Upon visual inspection, samples look quite similar without distinctive apparent features. However, spectral information of the coating in the visible/near-infrared region (VNIR) between 400-1000 nm can be used to detect thickness differences. A film thickness reference measurement was performed on all samples using ellipsometry (color-coded). This allows training of a supervised machine learning model to predict thickness of new samples.
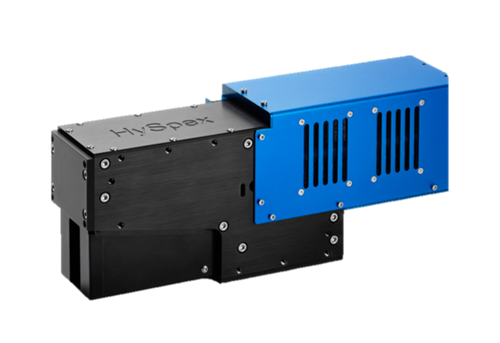
The thin film samples were scanned using the HySpex VNIR-1800 hyperspectral camera and a broadband halogen illumination source. The camera covers the spectral region of 400-1000nm with a spectral resolution of 3.26nm and a spatial resolution of 60µm. Featuring low background noise, high dynamic range, and superior signal-to-noise ratio, this state-of-the-art camera guarantees high-quality image data and the reliability needed for thin film analysis.
Starting the hyperspectral measurement, light reflecting off the surface of the samples is captured by the HySpex VNIR-1800 hyperspectral camera, recording the complete spectral information in the 400-1000 nm wavelength region for every single pixel within the scene. To train the model we are in this case only interested in the mean spectral properties of each sample, which are shown in Figure 2. While we can hardly see any differences between the samples by means of visual inspection, the spectral response detected by the camera clearly shows a shift in reflected intensity along the whole spectrum.
This distinctive information can be used to train a PLS regression model. Once a model is made it can then be used to predict the thickness values of each pixel in new images allowing us to either calculate an average sample value or to inspect thickness variation within each sample.
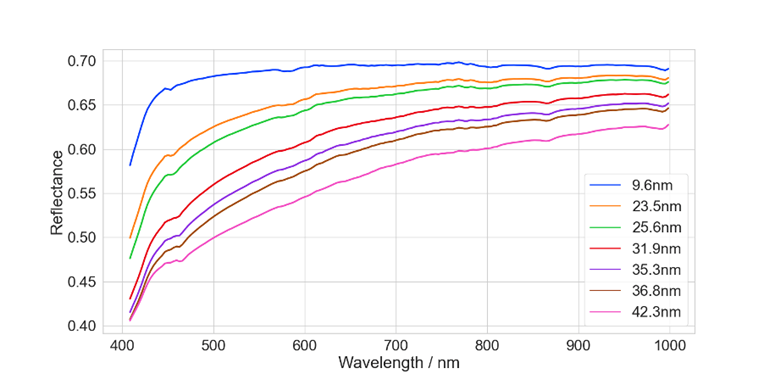
Figure 2. Mean reflectance spectra for all 7 samples (same color coding as in Figure 1). Changes in film thickness result in a change in spectral properties of the coating.
The dataset is relatively small for creating a regression model so Leave-One-Out Cross Validation (LOOCV) is applied to avoid overfitting the data. With LOOCV we train the model with 6 out of the 7 samples, test it on the left-out sample, and repeat the procedure for all permutations. Predicted vs. reference value is plotted in Figure 3. The R2 regression score both for including all samples in the model and for the cross-validated model is above 0.99, indicating a very good model fit, especially considering the small dataset and the point-measured reference values.
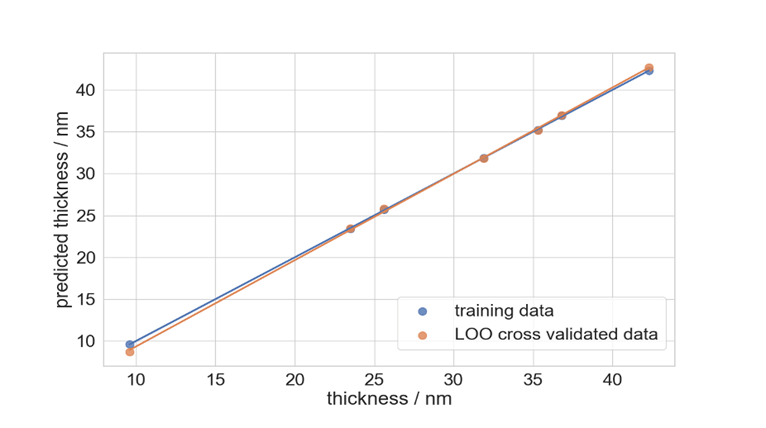
Figure 3. Thin film thickness values predicted by the PLS regression models trained using the complete dataset (blue) and using Leave-One-Out Cross Validation (orange) plotted against the measured reference value.
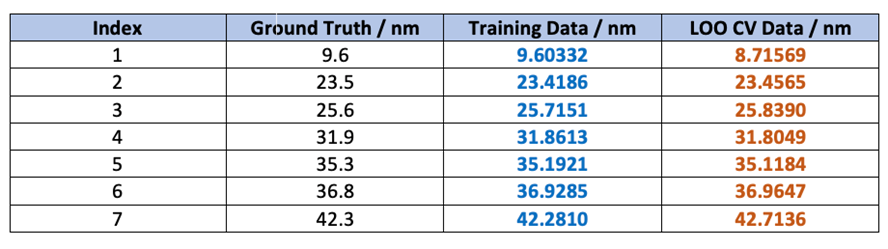
Table 1. Measured ground truth thickness vs predicted film thickness using the whole training data and vs predicted film thickness using leave-one-out cross-validated data. The R2 regression score is above 0.99 for both models.
This analysis shows that hyperspectral imaging with HySpex camera systems has great potential to be an effective and accurate tool for thin film thickness evaluation. Additionally, high spatial resolution and spectral fidelity allow for analysis of much finer details like local thickness variation, inhomogeneities, or impurities at a pixel level.
HySpex offers a varied selection of turn-key solutions for mining and raw material-related studies as well as other scientific and industrial applications.
Contact us to discuss your application and requirements with our specialists.
The data was acquired within the NanoQI Project with funding from the European Union’s Horizon 2020 research and innovation program under grant agreement Nº 862055. The sample set was provided by Fraunhofer Institute for Applied Polymer Research IAP, Potsdam, Germany.
![]()


-
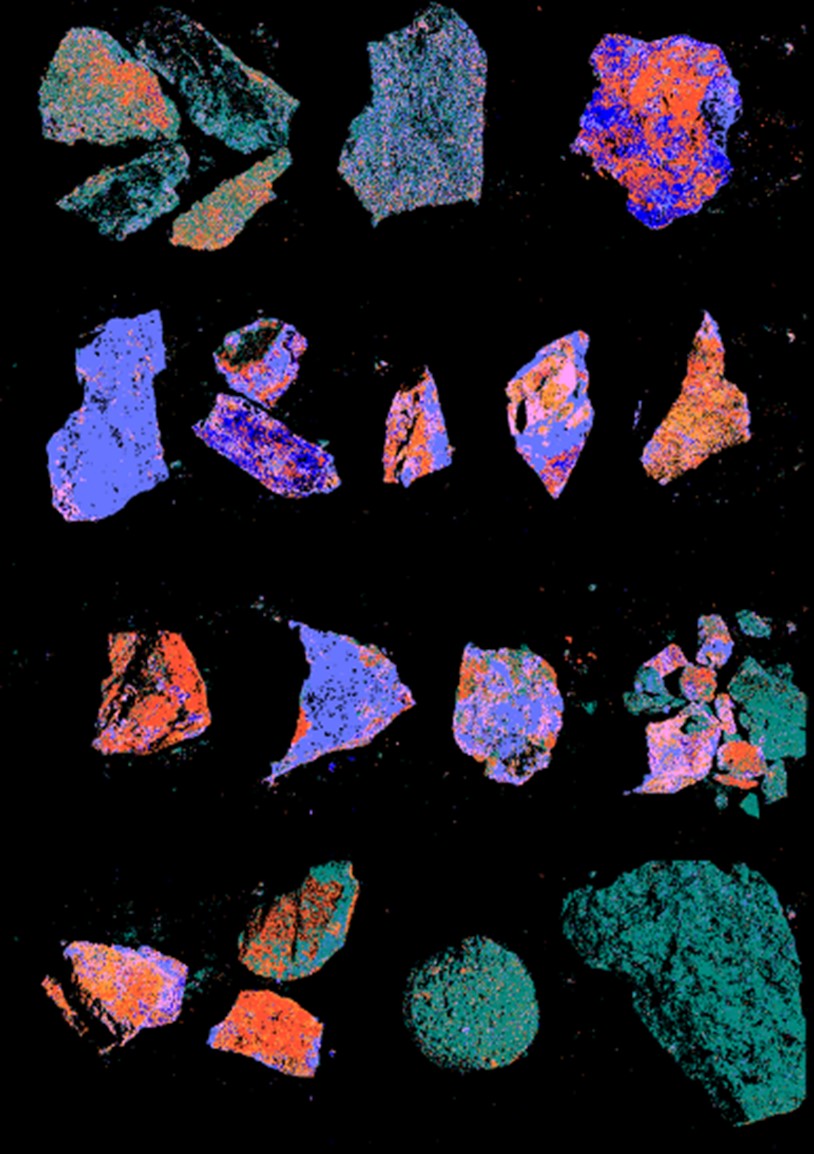
Hyperspectral Imaging for Lithology Mapping
Hyperspectral Imaging for Lithology Mapping
-
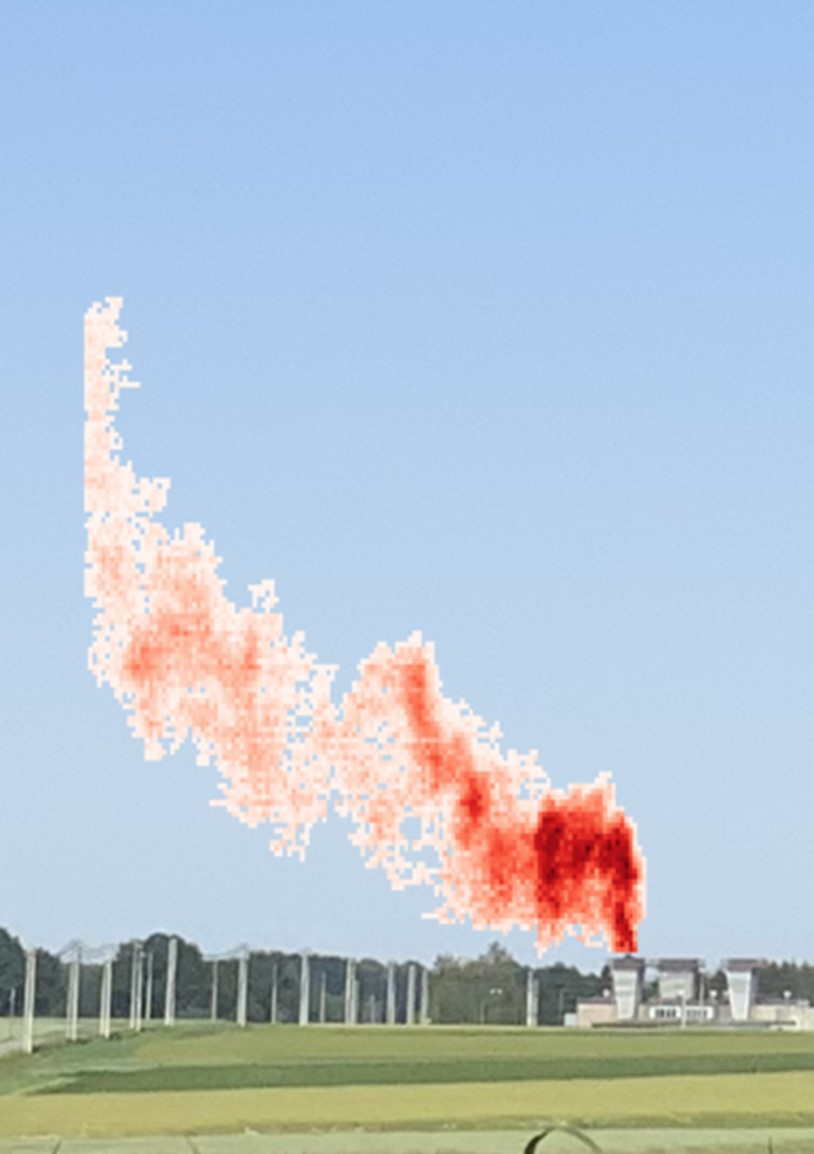
Unveiling the secrets of methane: monitoring emissions using HySpex SWIR cameras
Unveiling the secrets of methane: monitoring emissions using HySpex SWIR cameras
-
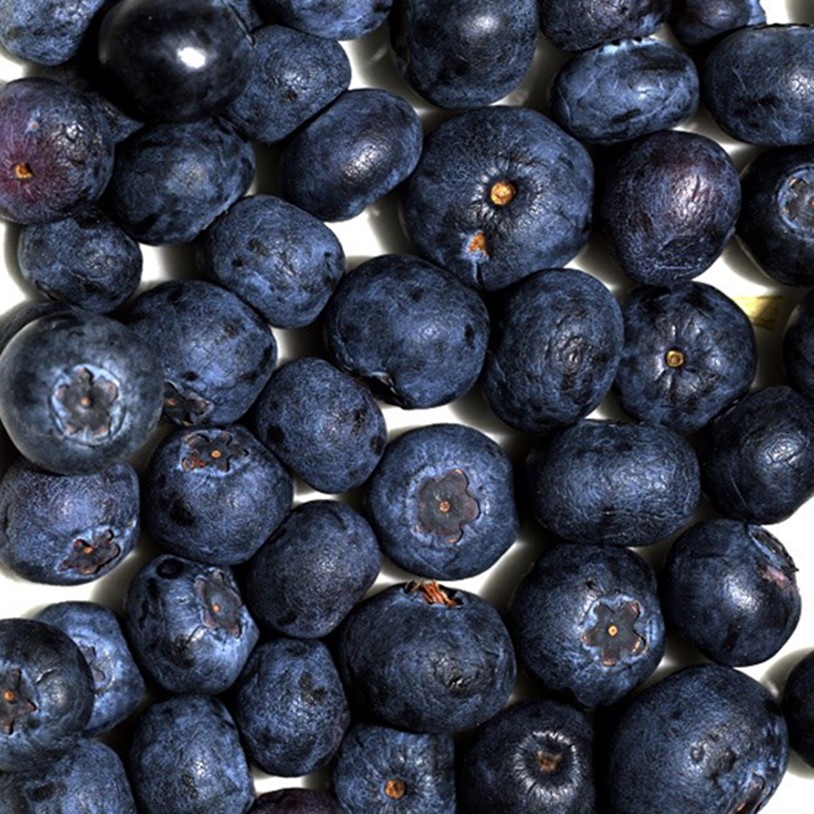
Shedding hyperspectral light on fruit quality
-
Hyperspectral Imaging for Ore Distinction
Hyperspectral Imaging for Ore Distinction
-

Hyperspectral Imaging for cocoa beans grading
Cocoa Beans
-
Carbonate Quality Modeling With HySpex and Breeze
Carbonate quality and contamination