Hyperspectral Imaging for Lithology Mapping
Case study for Lithium-bearing pegmatites in Portugal
Case study for Lithium-bearing pegmatites in Portugal
A rapidly increasing world population and innovation drives the global demand for raw materials. To meet this demand sustainably we need innovative technologies in the mining sector has to develop a selective mining where possible and to maintain a competitive edge. The aim has to be creating safe, highly efficient extraction-, sorting and recycling process.
Lithium is one of the raw materials in focus when discussing environment-friendly means of transportation e.g., by the use of rechargeable Li-ion batteries. The identification of new Li deposits and a sustainable approach to mine these deposits is crucial to meet those demands1. Hyperspectral imaging of samples and mine fronts can considerably improve the planning process by mapping small-scale changes within the mine front and the assigned extraction segments.
These changes are not always visually identifiable but can be relevant for the quality from an extracted build and for adjusting the subsequent processing steps. Imaging spectroscopy can help to identify and evaluate relevant minerals or lithologies before the extraction and lead to frequent, more efficient, and precise raw material identification.
In this example, data from the Bajoca open pit mine, Portugal, are used to illustrate the use of hyperspectral imaging for lithology identification. The Bajoca open pit is operated for feldspat mining for the ceramic and glass industry [2].
Figure 1 shows the samples and spectra library grouped into different geochemical groups relevant for the area – the spectra groups were built according to the expected rocks in the area and lithological mapping [2,3].

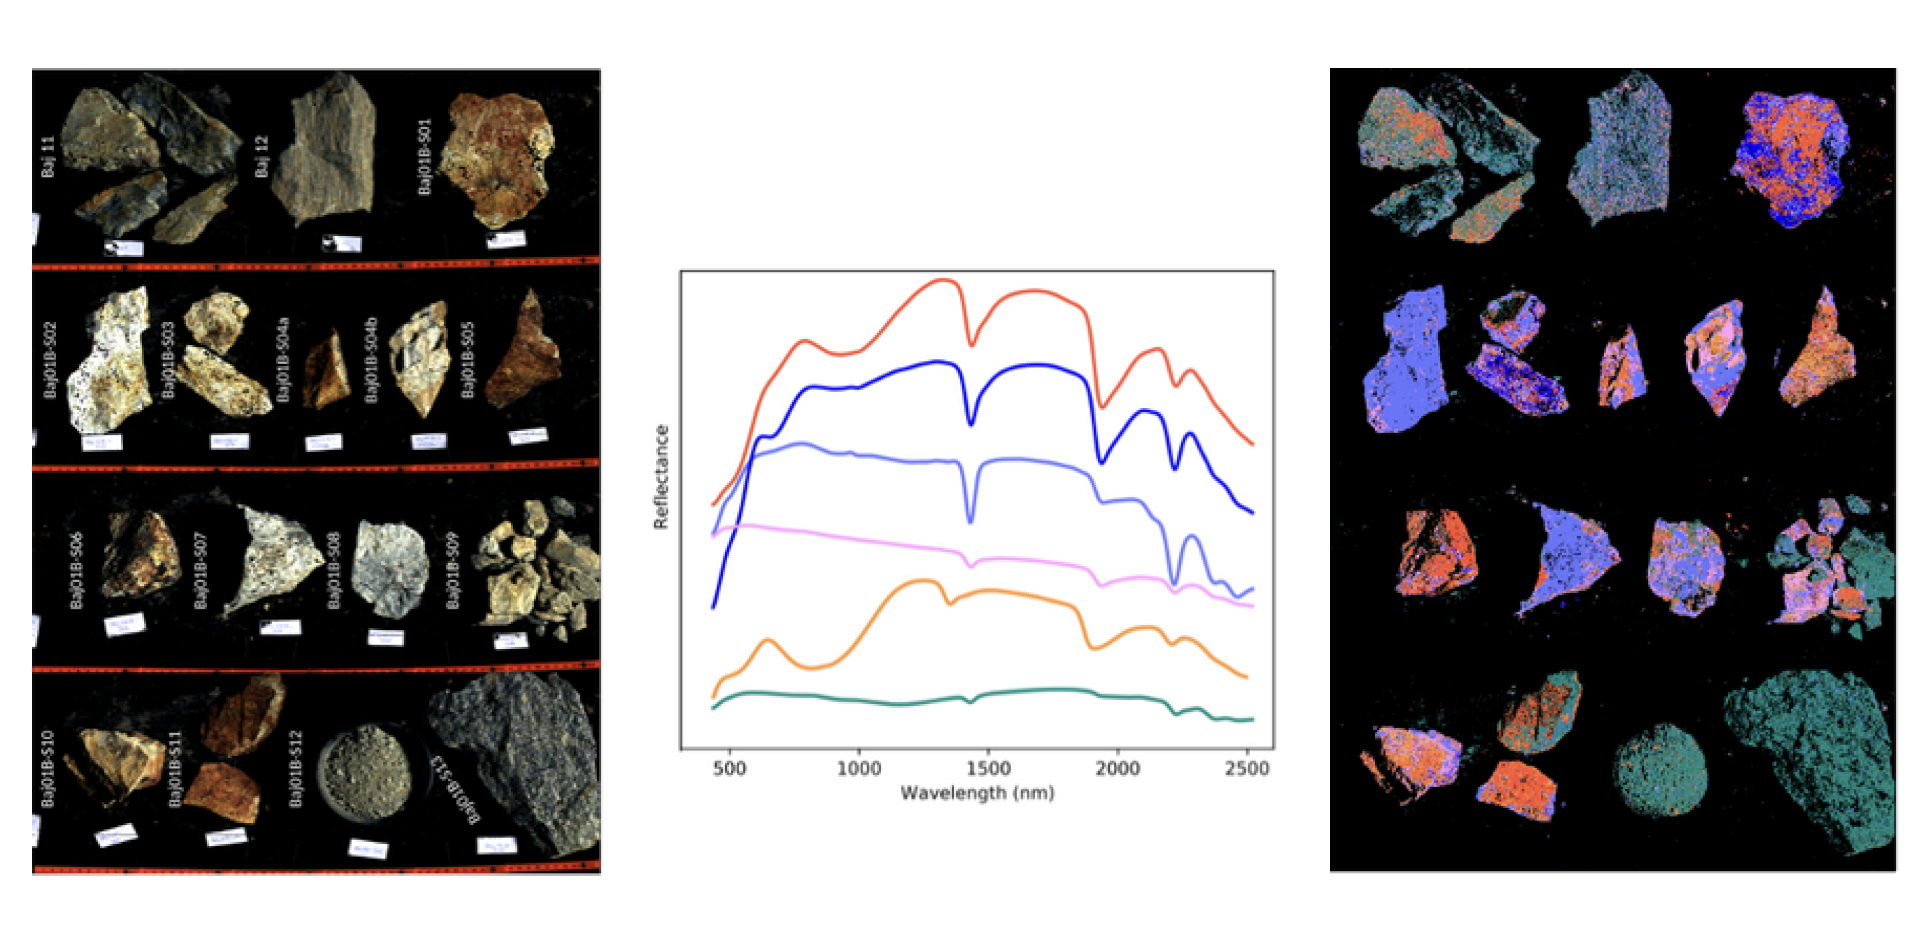
Figure 1: Sample-based spectral library. The 14 samples (left) collected on-site were analysed and characterised in the laboratory using both hyperspectral and traditional means. The samples spectra were then grouped in clusters according to their geochemically dominant features and the hand sampling (center) [5]. The spectral library-based classification (right) shows that the spectral cluster classes can be used to identify the samples on a sample level, but that the samples are not homogeneous and show a more differentiated picture on a pixel-level classification. The library was later used to identify the lithologies on the mine face.
The samples and mine face data were collected by the German Research Centre for Geosciences Potsdam (GFZ) within the LiGHTS project (Lightweight Integrated Ground and Airborne Hyperspectral Topological Solutions) [4,5]. The samples were analysed in the laboratory with VNIR and SWIR instruments from the HySpex Classics series. Mine face scans were acquired with the Mjolnir S620 SWIR system.
The samples were grouped according to their spectral representation according to the lithology and dominant surface covers expected2. A site-specific spectral library was created and two different mine face scans within the open pit were analysed (Figure 2 and Figure 3). Due to the strong atmospheric bands in the SWIR from broadly 1000 – 2000nm in the mine face scans, the analysis concentrates on the SWIR regions of 2000 – 2450nm only.
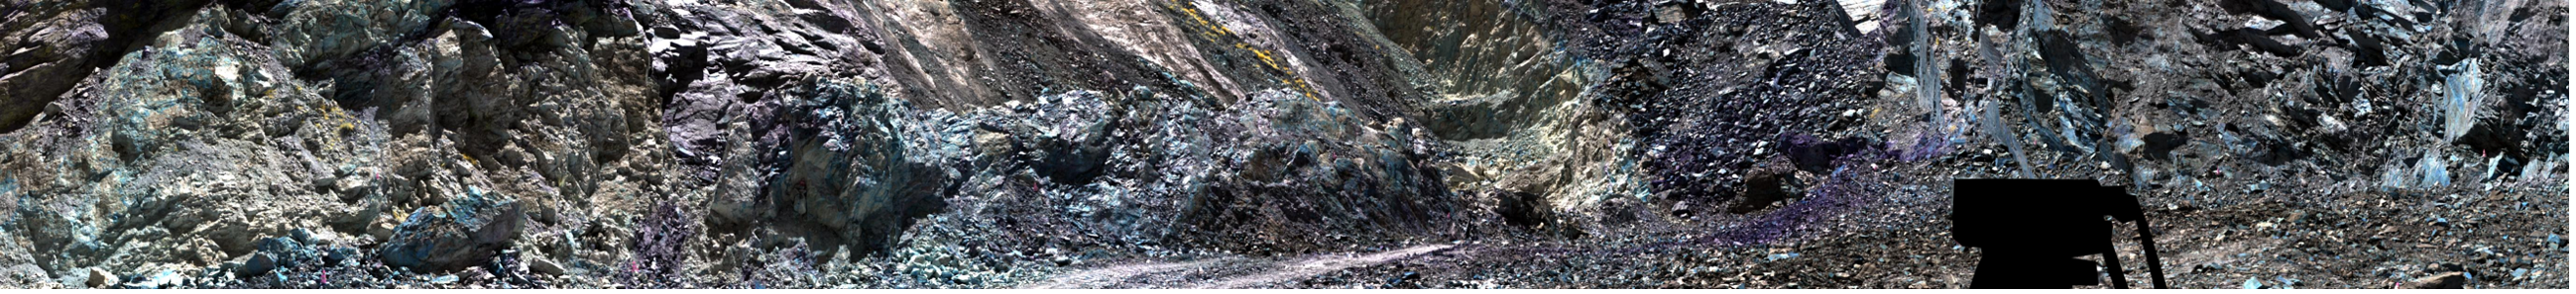
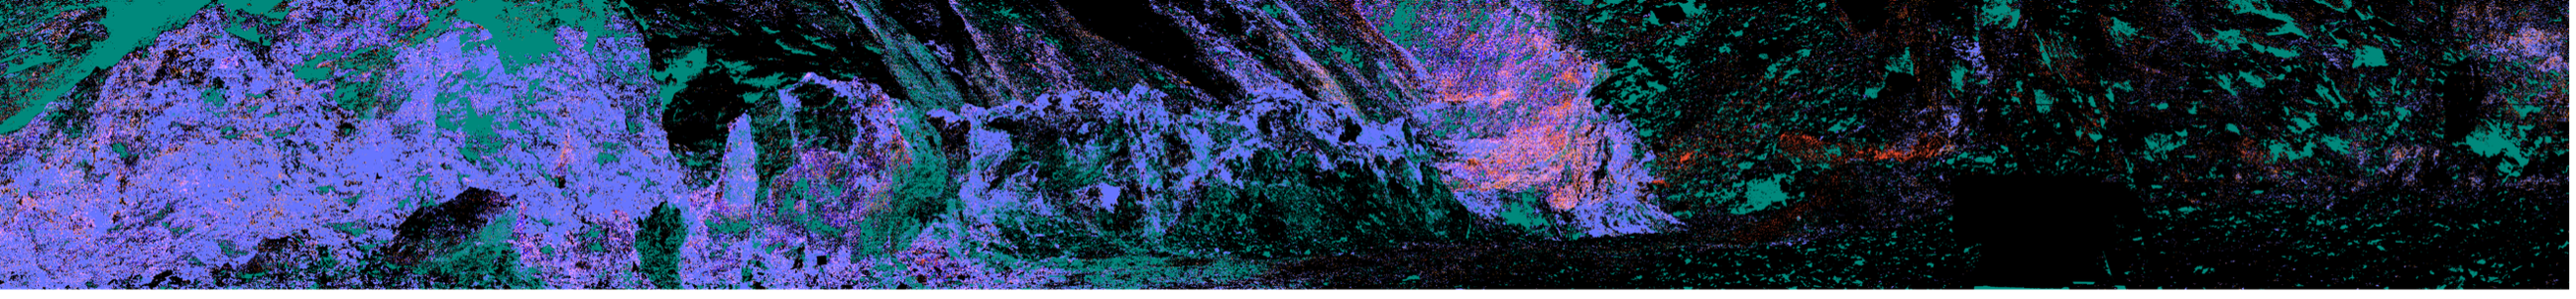
Figure 2.: Position 1 Top: Color-infrared of the mine face. Bottom: Classification of the mine face scan within the border of the Bajoca Li-bearing pegmatite vein (East) and the metasediment dominated area (West). Metasediments dominate the classification towards the left with a higher influence by the chloritic content. The classification shows, that clay-minerals and phyllosilicates dominate the classification. “Fresh pegmatite” is classified in the fresh open cut in the centre of the image.


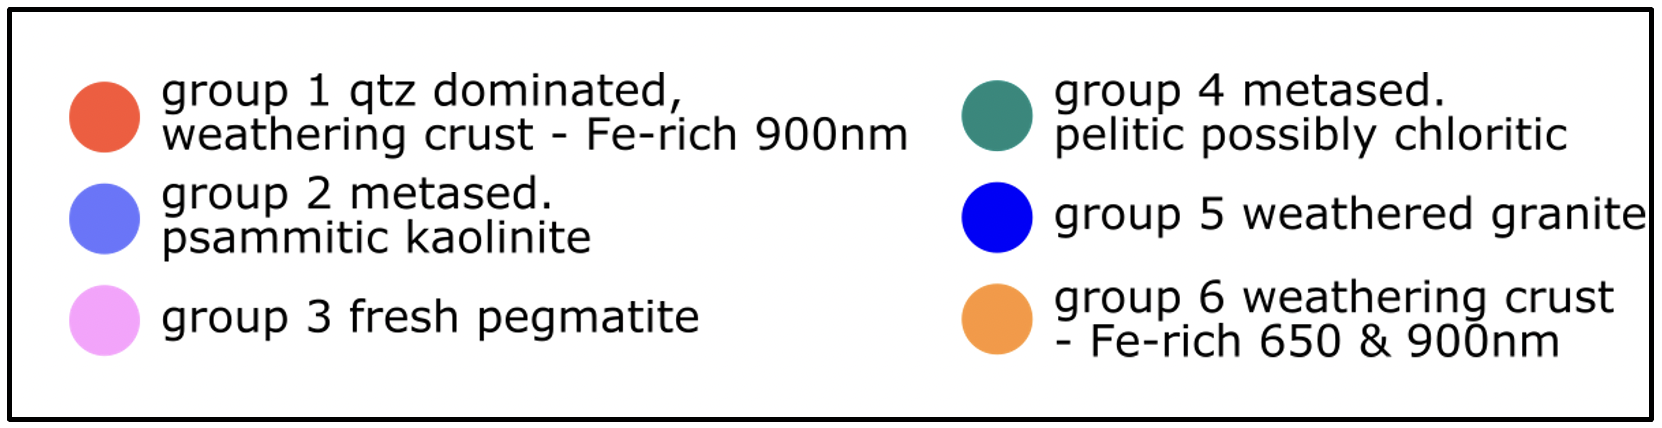
Figure 3.: Position 2 Top: Color-infrared of the mine face. Here, the sampling took place resulting in the spectral library applied for this classification. Bottom: Classification of the mine face scan within the Bajoca pegmatite vein. Kaolinitic weathering dominates the outcrops, the center however shows a more differentiated image of chloritic metasediments and higher degrees of iron surface weathering. Position 1 is located towards the West (right) of this image.
The mine face scan of “position 1” (Figure 2) is located in the west of the open pit shows a clear distinction between the Li-pegmatite toward the East, here classified by its dominant clay and chlorite content. The Li-pegmatitic vein is bound towards the West, seen in Figure 4 by the changes in color from dark metasediments in the West and the lighter pegmatite vein in the center of the open pit. The color infrared of the SWIR data also shows different spectrally similar regions within the Li-pegmatite (blue areas). The analysis of “position 2” (Figure 3) is located within the area of the pegmatitic vein. Larger areas of the imagery are classified as kaolinite dominated, towards the centre and the more enriched zone in the South, areas are mapped as chloritic (green) and iron dominated (red). The two scanning positions within the open pit are shown in Figure 4.
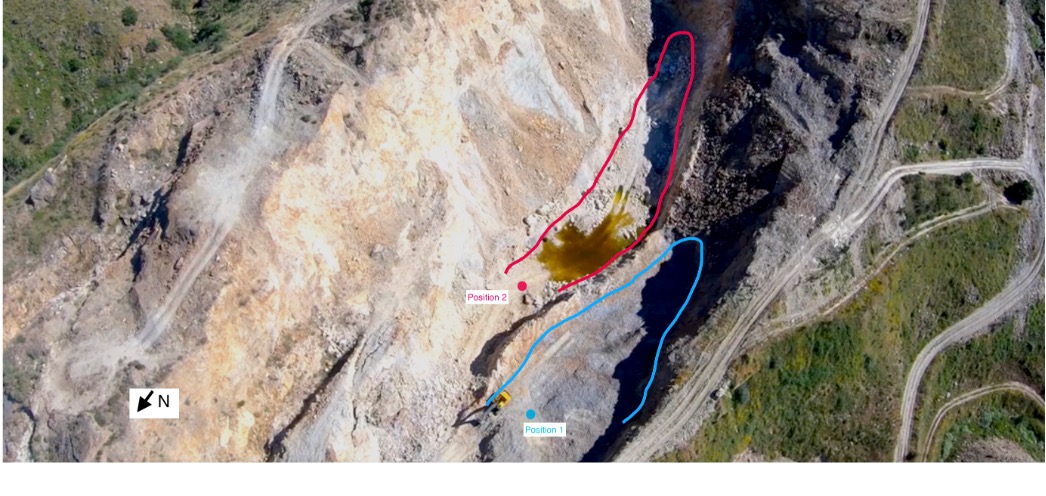 Figure 4: Position of the two mine face scans within the Bajoca open pit. Position 1 in blue and position 2 in red. Dots show the position of the HySpex camera, the line shows the area that is represented within the rotational scanlines.
The hyperspectral data in this project was acquired using a SWIR camera from the HySpex Classic series. The SWIR-384 operates in the 930 – 2500 nm range with a spectral resolution of 5.5 nm. The SWIR spectral region is e.g., able to pick up differences in clay and mica mineralogy important in this open pit. In the laboratory, the VNIR data of the samples were acquired as well, covering the spectral range of 414 – 1000 nm.
The HySpex Classic cameras are designed to operate in both the laboratory and the field, preserving the spectral fidelity needed for scientific and industrial applications thanks to their low-value optical aberrations, thermal stability, and custom lenses for a variety of working distances. The portable field system utilizes a battery-based, rugged data acquisition unit to power and controls the cameras as well as the necessary moving stages.
The data was acquired within the LiGHTS project by the German Research Centre for Geosciences GFZ Potsdam. LIGHTS was funded by national research agencies under the EU H2020 ERAMIN-2 network.
The example shows the potential of hyperspectral imaging as a tool for geological and mining applications. Its use allows for the precise identification of minerals and materials anywhere from exploration and mining to processing and manufacturing. HySpex offers a varied selection of turn-key solutions for scientific and industrial applications. Contact us to discuss your application and requirements with our specialists.