
Hyperspectral Imaging for Ore Distinction
Case study for iron and nickel ore samples
Case study for iron and nickel ore samples
Metals like iron, copper and gold, as well as resources like coal and limestone are commonly extracted using the open-pit mining method. The planning of the extraction is divided into long-term, short-term, day-to-day and shift-to-shift planning. In the day-to-day activities, the planner decides based on prior sampling and drill cores which material from the broken stock is fed to the crusher or included in the processing plan to achieve the daily production rate.1 Hyperspectral imaging of samples and mine fronts can considerably improve the planning process and lead to faster, more efficient, and precise ore grade determination. The successful implementation of in-mine quality mapping using hyperspectral imaging potentially supports several processes. These include maintaining ore grades within the desired range during mineral production, minimizing the level of contaminants for optimal ore processing and enabling a higher reliability in sending low-grade ore to the waste sites and thus to minimize operating cost.
It is predicted that hyperspectral imaging will play an important role in the future in optimizing mining short-term objectives. So far, real-time analytics, predictive machine learning and image analytics are being applied at only 35%, 38% and 37% of the mines respectively2. Especially exploration, mine development and ore processing are lagging behind in the race for digitalization. An example of how hyperspectral data can be used in this context is presented here using results obtained from two independent studies using HySpex instrumentation.
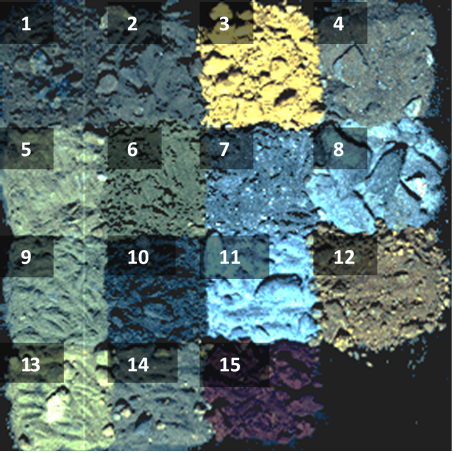
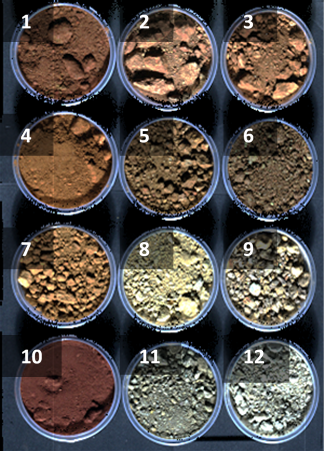
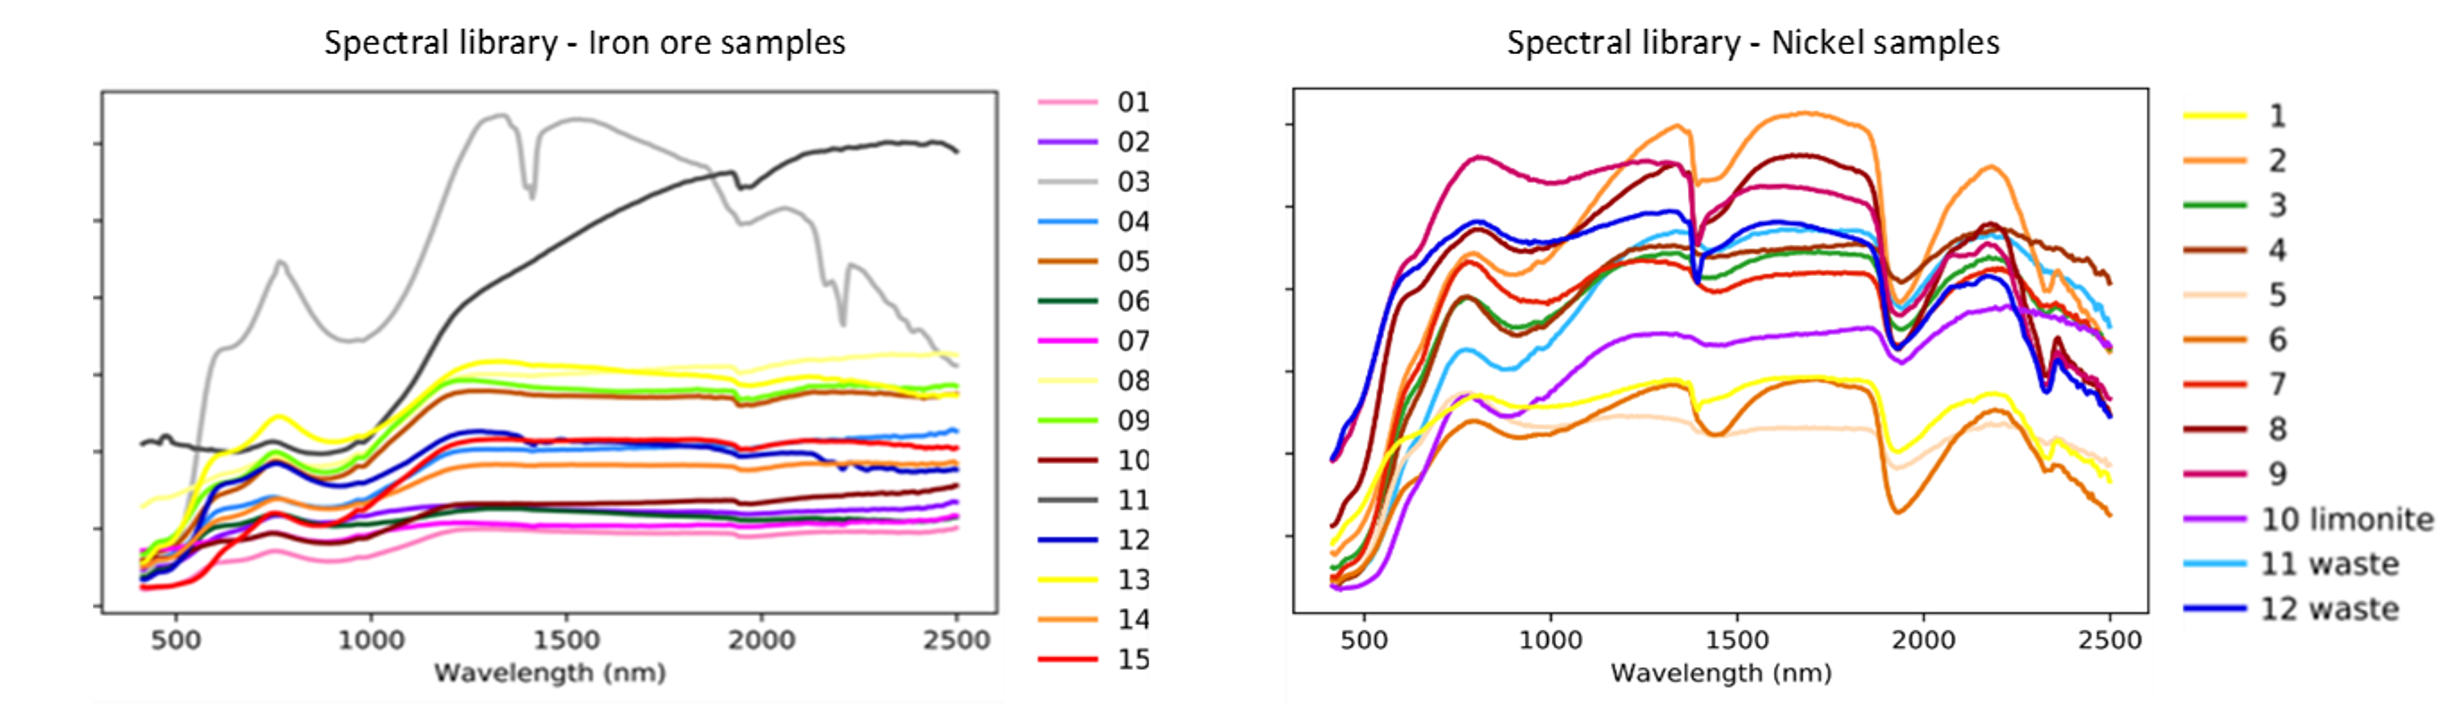
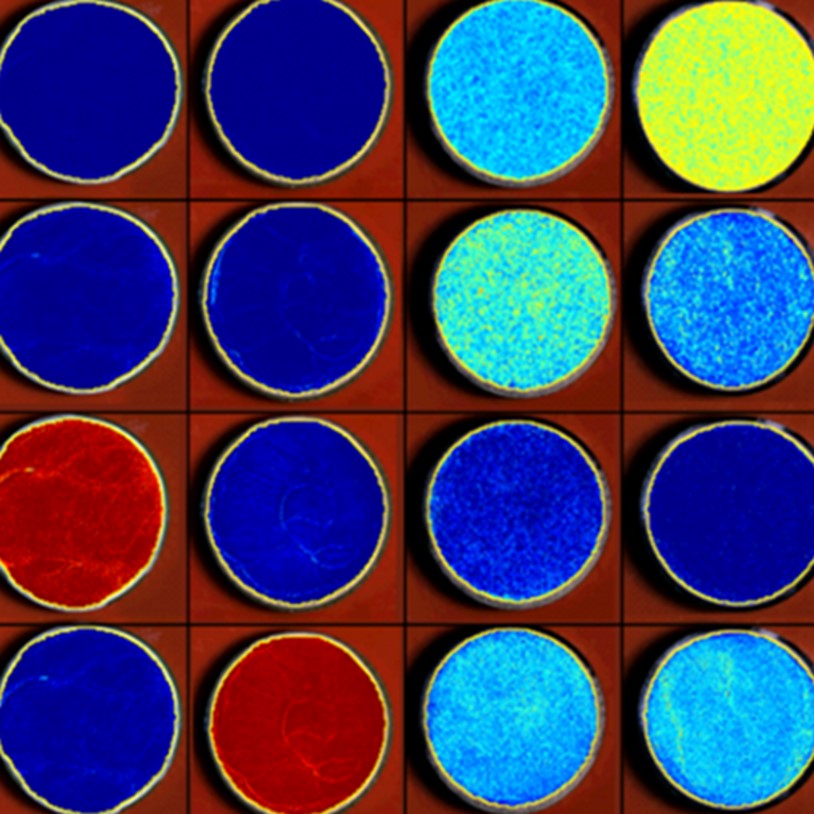
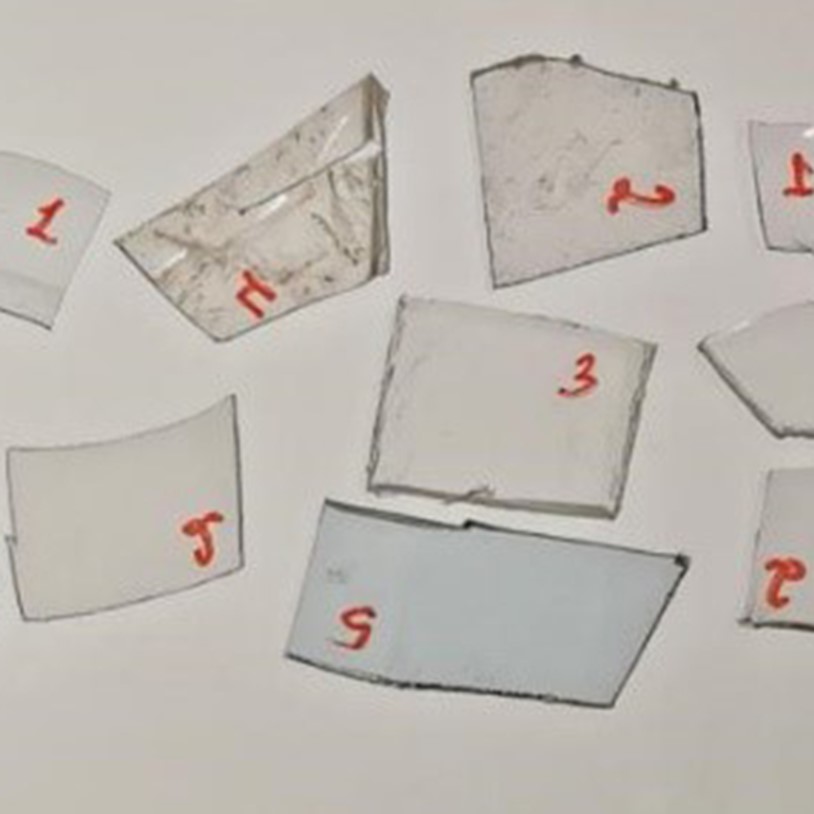
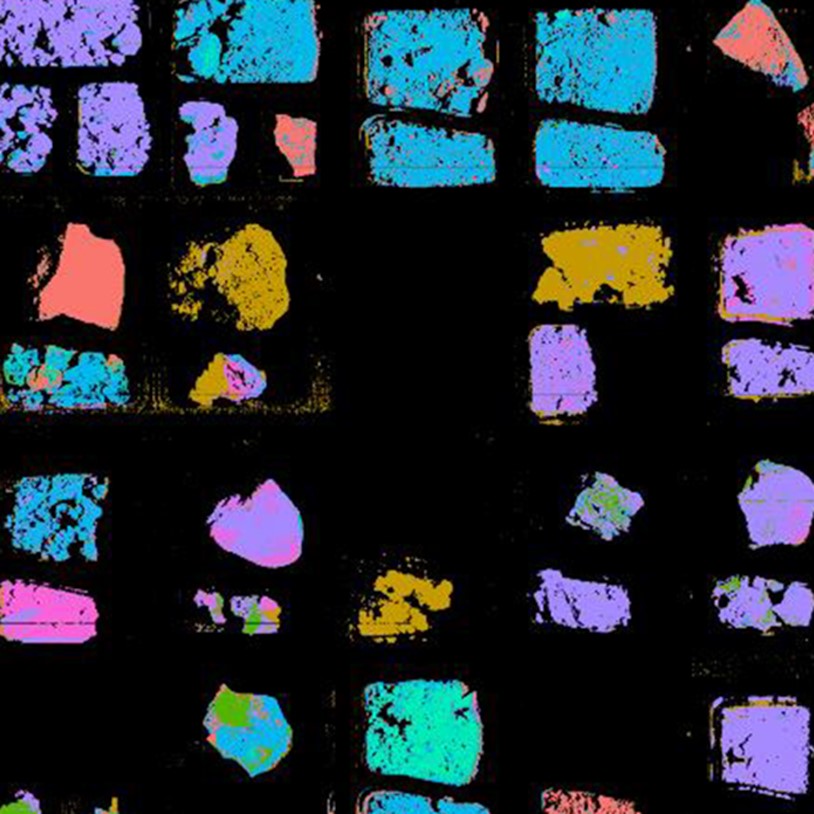
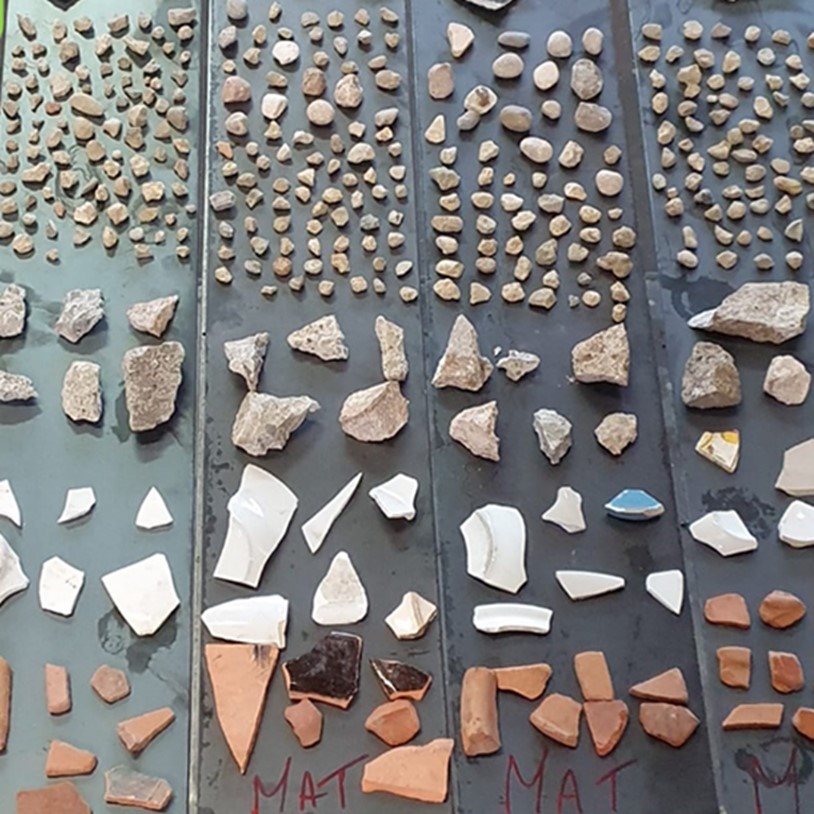
The samples were used to create a site-specific spectral library (Figure 2), to be applied for e.g., UAV imagery analysis of large mining complexes. The analysis of the iron samples was performed using the hybrid ReSens+ analysis and was compared to the open source GFZ EnGeoMap feature-based analysis4 and the Spectral Angle Mapper (SAM).5 The nickel samples were analyzed similarly but were distinguished by sample quality instead of sample ID.
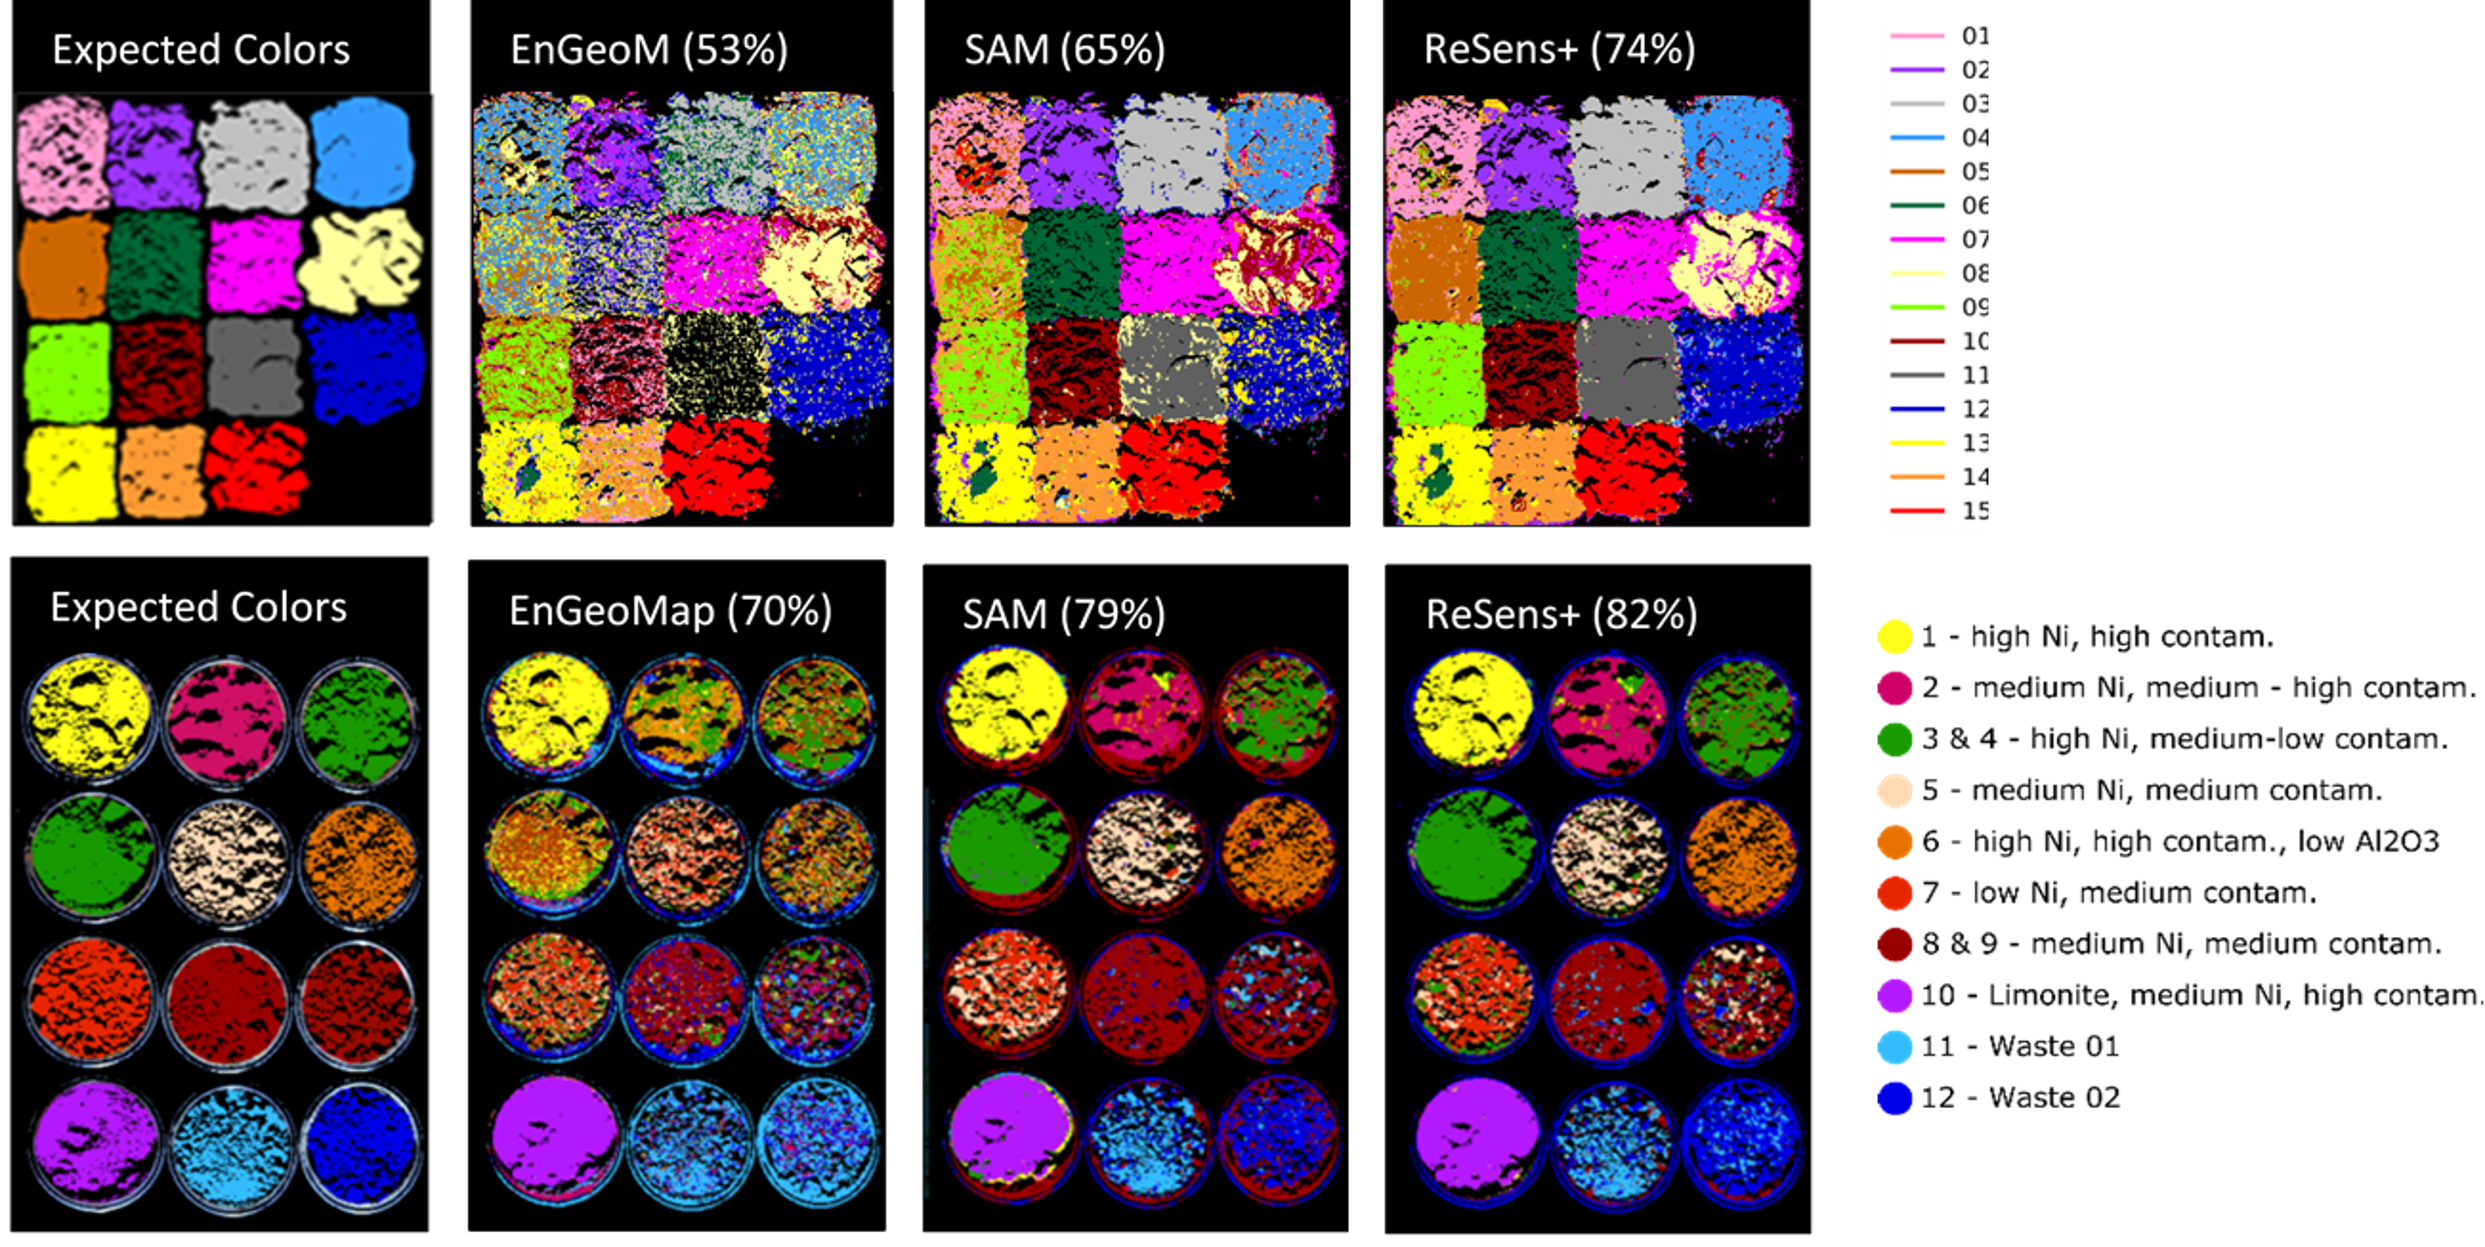
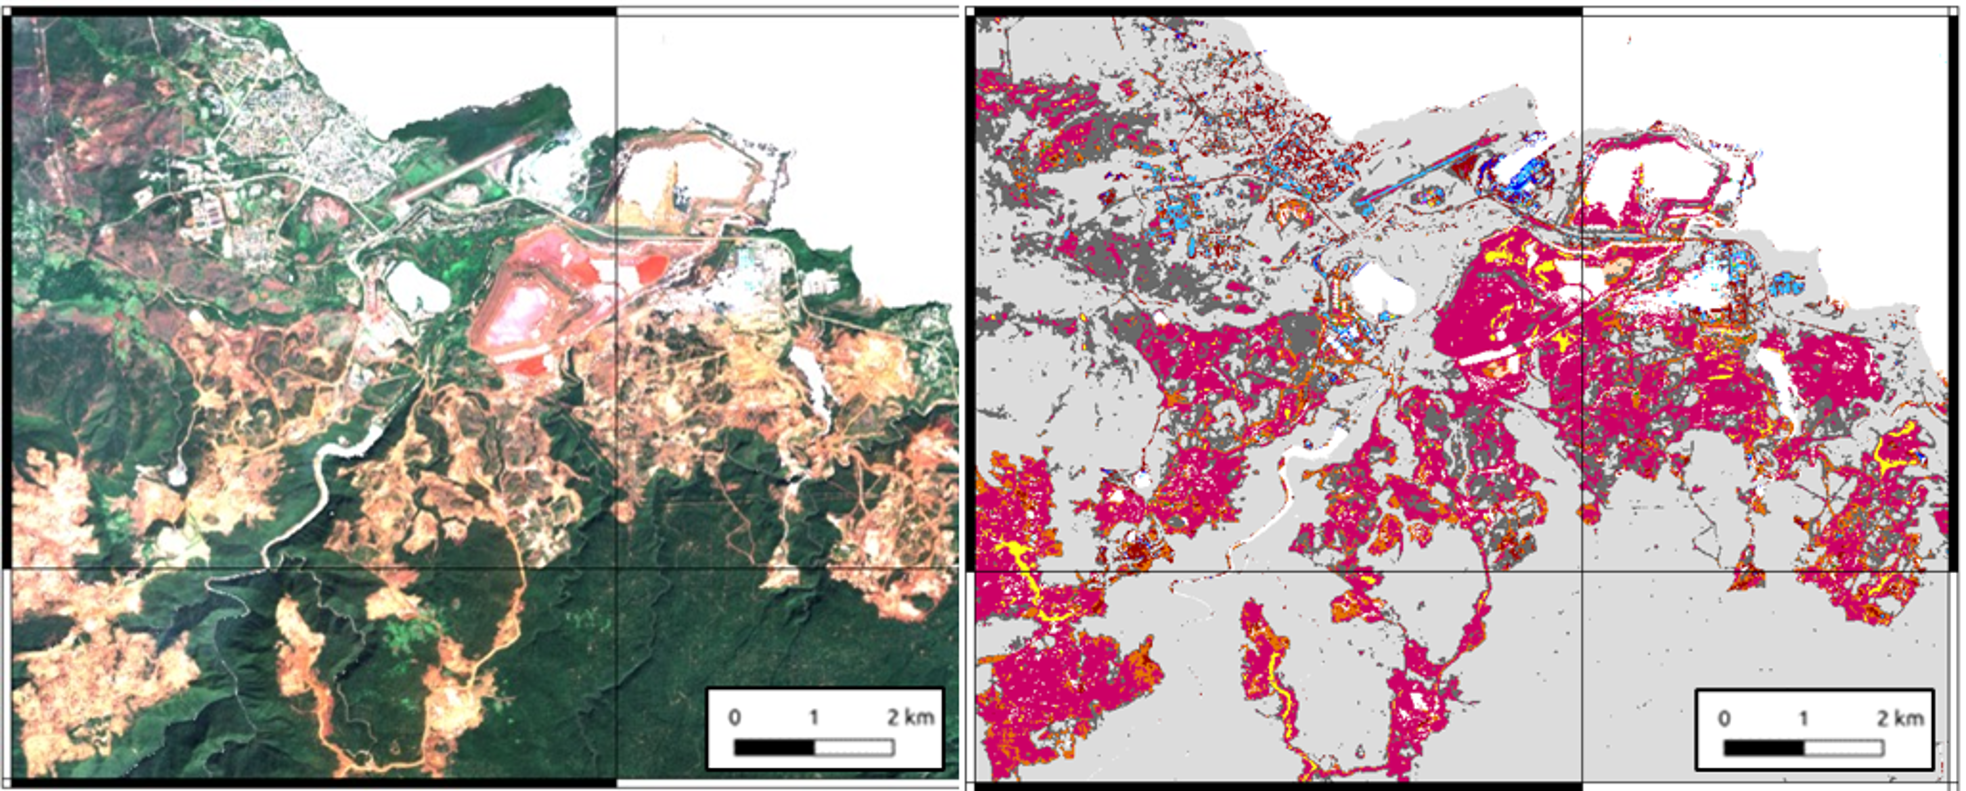
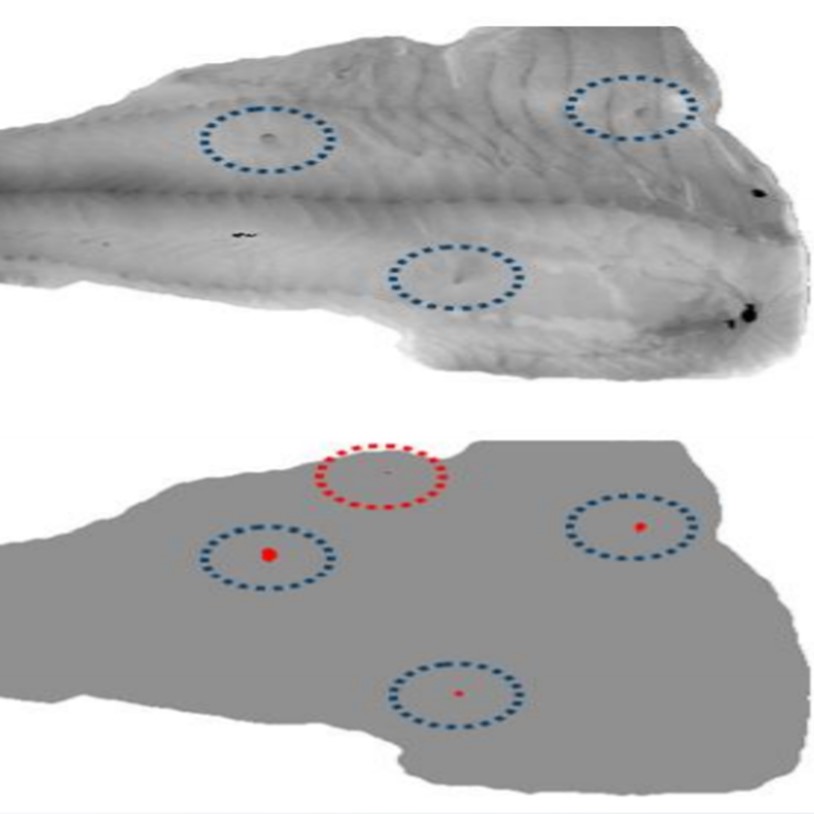
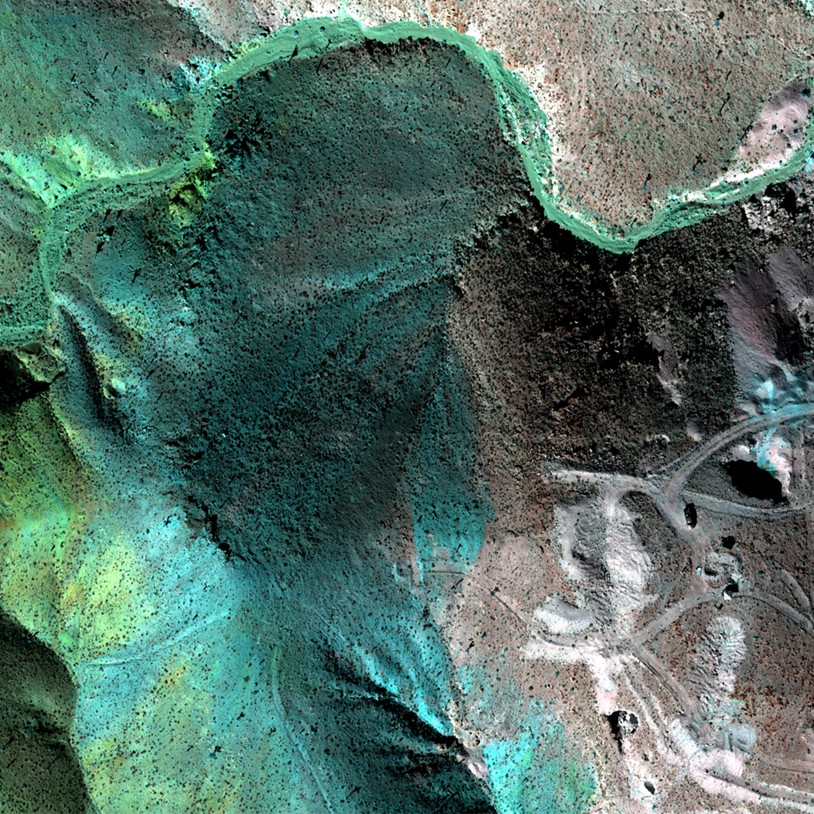
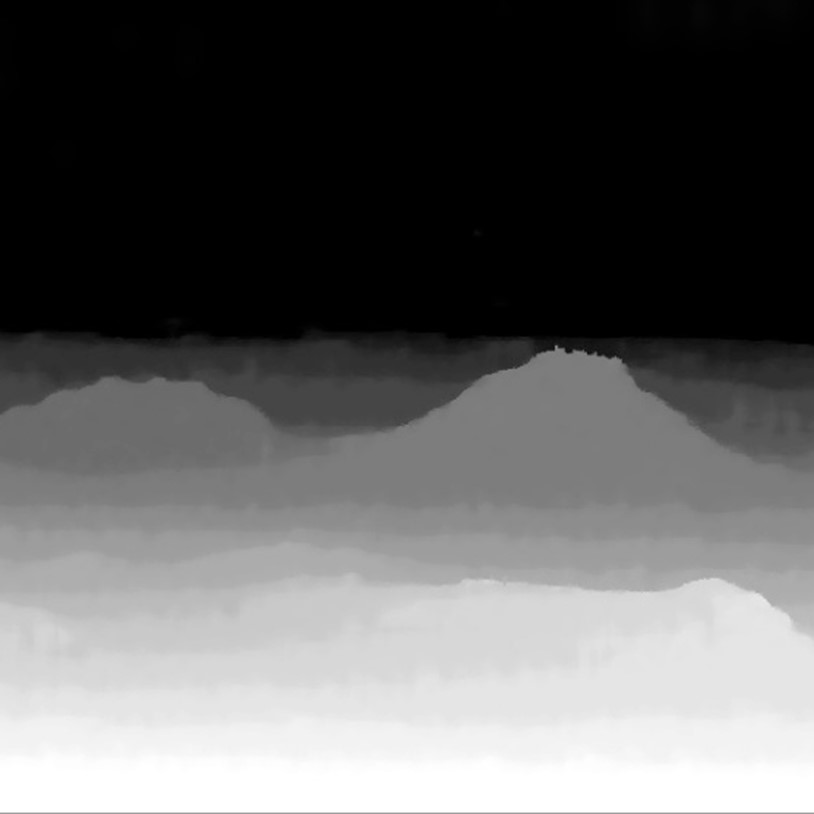
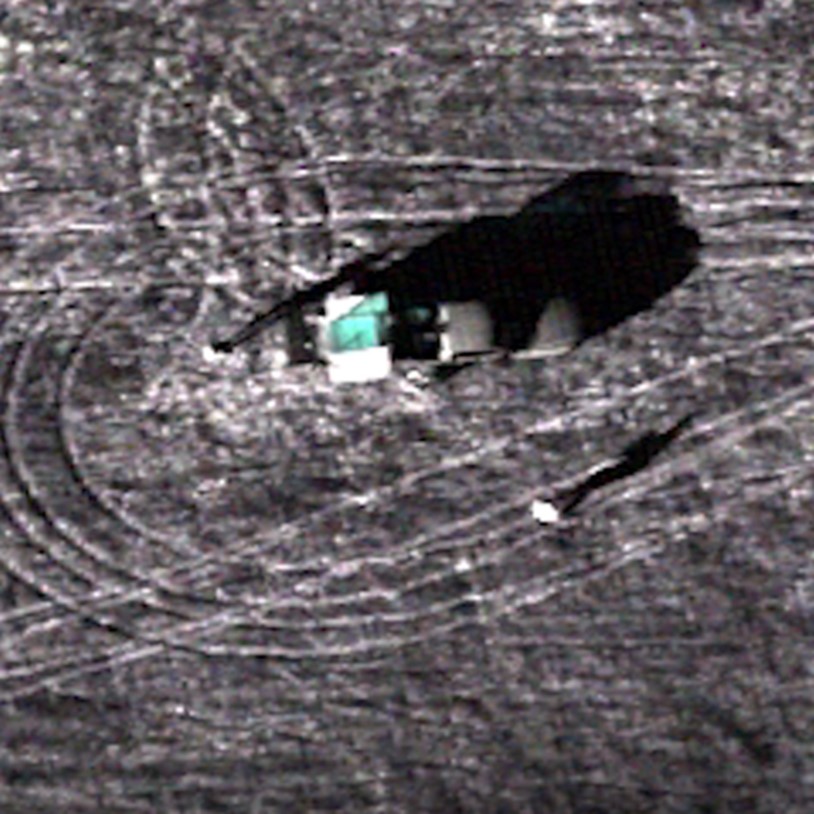
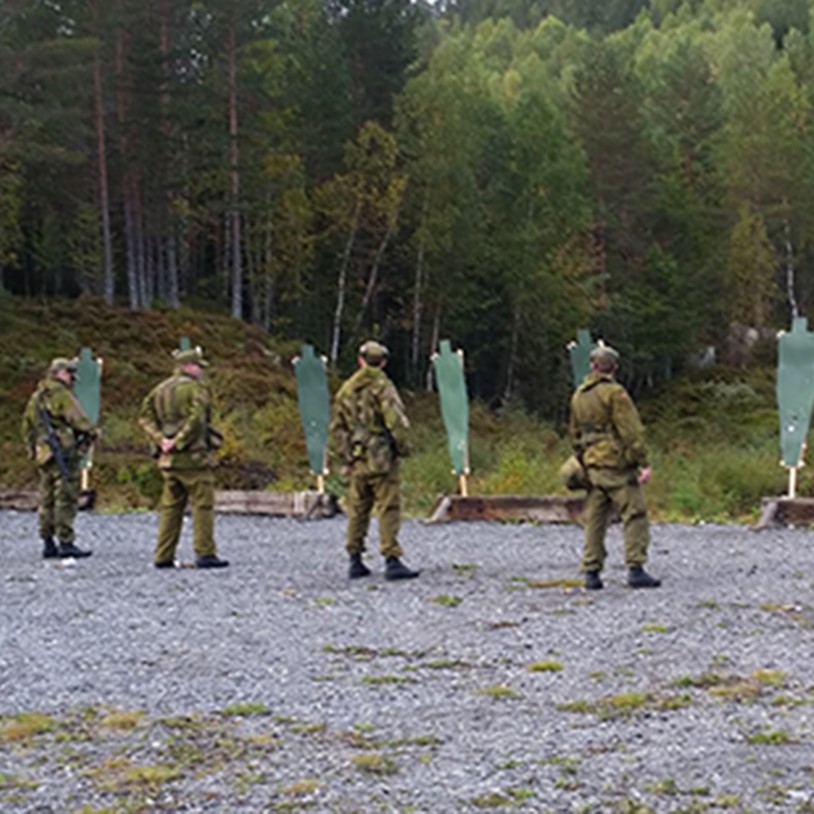
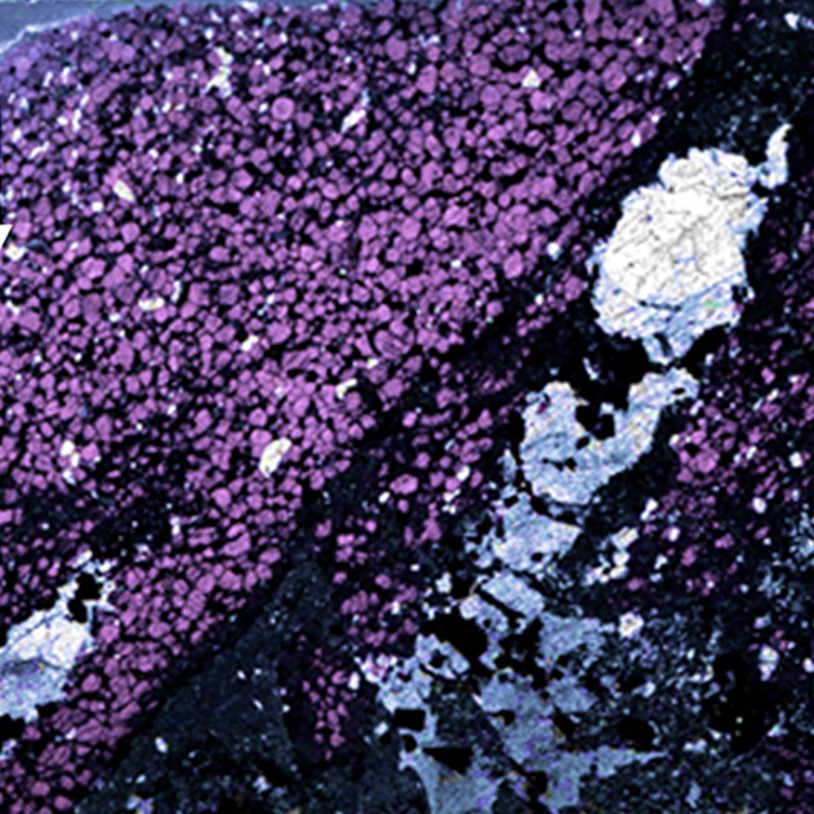
The different analyses show how clearly all the samples can be distinguished by hyperspectral means (Figure 3). It also shows that for samples with a low spectral contrast, the feature-based analysis (EnGeoMap) is inferior to analyses that take the overall shape of the spectrum into account (ReSens+ and SAM). ReSens+ analyses show the highest accuracy in sample recognition and a higher tolerance for shadows and coarse areas. This allows for analyzing samples without prior preparation (e.g., grinding) but also for an application under real, harsher mine face conditions.3 The laboratory compiled spectral libraries can be utilized and applied to analyze spectral data from different platforms, e.g., mine face scans on-site or even satellite data to monitor the large-scale mining progress (Figure 4).
The hyperspectral data in this project was acquired using VNIR and SWIR cameras from the HySpex Classic series. The VNIR-1800 camera covers the 400 – 1000 nm range while the SWIR-384 operates in the 930 – 2500 nm range. The cameras have a spectral resolution of 3.3 and 5.5 nm, respectively.
The cameras are designed to operate in both the laboratory and the field, preserving the spectral fidelity needed for scientific and industrial applications thanks to their low- value optical aberrations, thermal stability, and custom lenses for a variety of working distances. The portable field system utilizes a battery-based, rugged data acquisition unit to power and control the cameras as well as the necessary moving stages for scanning.
The data analysis was performed with material classification algorithms primed by GFZ and advanced and distributed within the ReSens+ product family by rad.Data Spectral Analytics UG (limited), They provide fast, high- precision geoinformation about quality, quantity and location of minerals and materials across all hyper- and multispectral scales and platforms.
The samples were provided by InnovBrazil, the “One-Stop-Shop” for German Mining Technologies & Innovation for Projects in North Brazil. They deliver solutions for higher-efficiency, sustainability and health & safety in exploration and mining.
The use of hyperspectral imaging allows for a precise identification of minerals and materials anywhere from exploration and mining to processing and manufacturing. HySpex offers a varied selection of turn-key solutions for scientific and industrial applications.
Data, results and images courtesy of:

Download this application note.
References:

Pharmaceuticals
Methane Detection
Plastic Sorting
Mineral mapping in open pit mines
Asbestos
Explosives
Hyperspectral Imaging for Ore Distinction

Hyperspectral Analysis of Powder Mixtures

Paper Recycling
Rare Earth Elements

Coating thickness

Monument Preservation

Cocoa Beans