Carbonate Quality Modeling With HySpex and Breeze
Case study to predict dolomite sample contamination
Case study to predict dolomite sample contamination
Hyperspectral imagery for carbonate quality and contamination offers a quick solution for resource mapping and modelling.
A previous case study looked at dolomite halfcores from Franzefoss Minerals AS in Norway to study mineralization occurring in the vicinity of dolomite and affecting the quality of the extracted rock e.g., mica and claygroup mineralization.
Additionally to these cores, 51 powdered dolomite samples were provided. The samples are based on composites from three blasts across the mine face (representing 10 x 10 x 5 m volume). The material is milled to <65um, homogenized samples are analysed for brightness, LOI, and X-Ray Fluorescence (XRF) for geochemical oxide composition. Brightness (L), CaO, MgO, and Fe2O3 content are modelled in Prediktera’s Breeze software, to give spatial information and insight into the different quality parameters of the dolomite product.
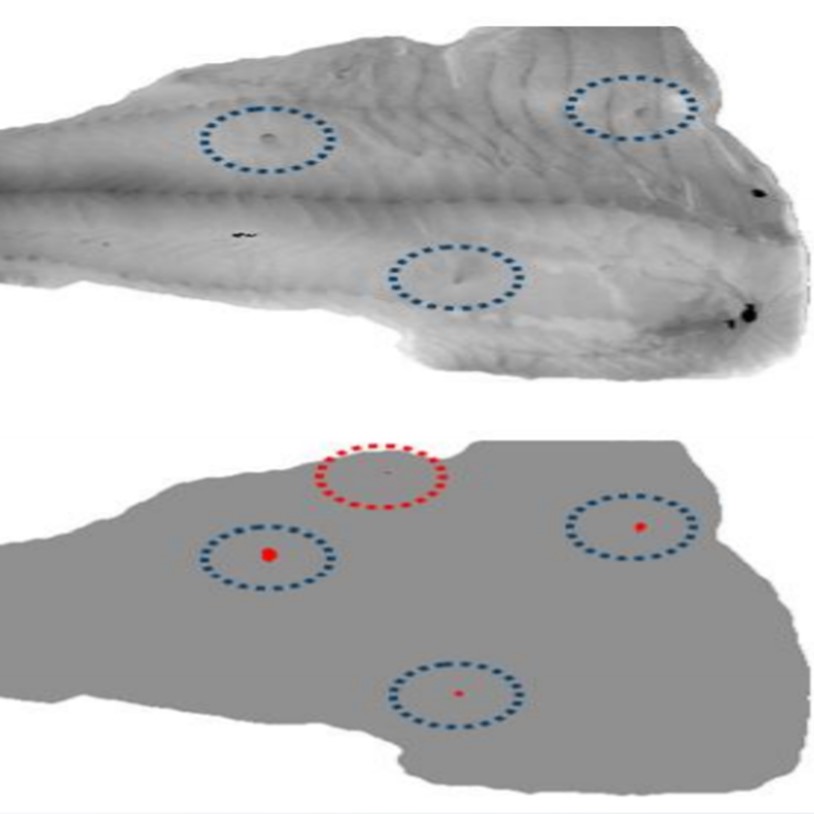
Modeling in Breeze is done via Partial Least-Square (PLS) regression, the 51 samples were transferred into sample dishes and loosely pressed, and 4 individual SWIR scans captured all 51 samples. The powders were scanned with the HySpex SWIR- 384 using the 30cm lens, resulting in data with a pixel resolution of around 0.26mm along and across track. Individual samples are segmented within Breeze and split into sub-samples via a 6x6 grid (see Figures 2 & 3).
PLS training for quantification is done on a balanced training set 210 subsamples and testing on 237 sub-samples; of the 1334 total subsamples, 447 are used for training and testing. 266 of the original 288 wavelength bands are utilized for the PLS, excluding 4% of the first and the last SWIR bands as per default in Breeze.


The dataset for modeling is balanced within Breeze itself. The 266 utilized spectral bands are smoothed spectrally by a Savitzgy-Golay filter and pre-treated by Standard Normal Variate correction (SNV). Model improvement includes the exclusion of outliers.
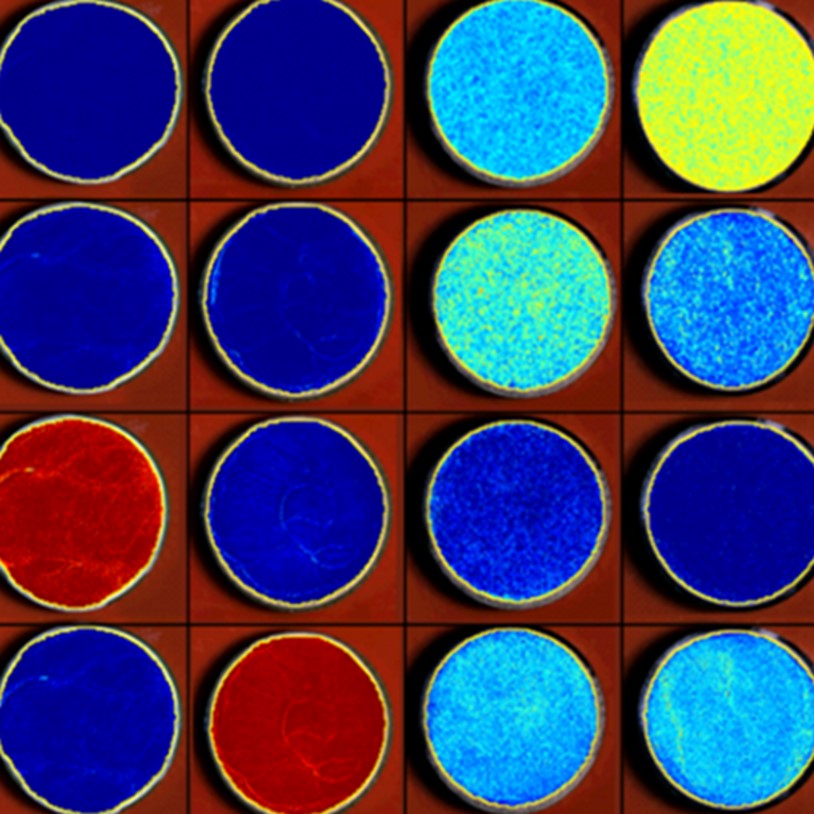
Figure 1 shows an RGB representation of a subset of the samples as well as the predicted brightness in the Breeze quantification model. Figure 2 shows the segmentation and the subsetting of individual samples into a 6x6 grid. Variations of the parameters of interest are shown in Table 1, and for brightness in Figure 3.
All samples were scanned using cameras from the HySpex Classic SWIR (970-2500nm) spectral regions with a spectral sampling of 3.3nm and 5.5nm, respectively. They were operated in the laboratory on a translation stage setup.


Figure 2. Top: Segmented samples within Breeze, individual samples visual by the red outline; Bottom: 6x6 sampling grid within Breeze.

Table 1. Parameter minima, maxima, average, median and standard deviation.

Figure 3. Minimum, maximum, average, median and standard deviation for the brightness of the 51 samples.
Modeling qualities are shown in Figure 4, all models achieve R2 values above 0,81. The models show a clear correlation between the spectral data and the parameters of interest (brightness and Ca-, Fe- and Mg-oxides). The application on powdered samples shows encouraging results, how these findings can be applied to the conveyor- or mine face scale for a close-to-face sorting is part of further investigations.

Measurements like these enable material control based on mineralogy at an early stage. Material streams can be monitored and unwanted mineralization can be discarded. This way, contaminated, low-quality dolomites are not distributed further into the processing stream, saving reagents, energy, and water.
HySpex offers a varied selection of turn-key solutions for mining and raw material-related studies as well as other scientific and industrial applications. Contact us to discuss your application and requirements with our specialists.
Samples and expert input were provided by Franzefoss Minerals AS, Norway’s leading limestone mining company with a strong focus on the environment
Data, results and images courtesy of:

References:
App note photo from https://www.muschelkalkmuseum.org/ausstellung/rohstoff_muschelkalk/
Methane Detection
Asbestos
Hyperspectral Imaging for Ore Distinction

Hyperspectral Analysis of Powder Mixtures

Pharmaceuticals
Plastic Sorting
Explosives

Paper Recycling
Rare Earth Elements

Coating thickness
Monument Preservation

Cocoa Beans