White Micas and Mineral exploration

Mineral deposits are critical to solving society’s mineral demand, but many are well hidden beneath the surface. Finding these deposits has been a longstanding challenge for geologists and exploration teams. However, in recent years, hyperspectral remote sensing has emerged as a powerful tool using the surface’s reflected energy to identify specific minerals based on their unique spectral signatures.
What is hyperspectral remote sensing?
Hyperspectral imaging (HSI) involves capturing light reflected from the Earth's surface across a wide range of wavelengths in consecutive, narrow wavelength intervals. By analyzing this reflected light, geologists can identify the presence of specific minerals with remarkable accuracy.
Spectroscopy can be applied to crystalline and amorphous materials alike and is sensitive to the chemical bonds in the material, the crystalline structure, and the texture of the surface. The technology utilizes specialized imaging spectrometers mounted on tripods, UAVs, aircraft, or satellites to collect data about the Earth's surface cover and mineral composition.
How are white micas significant in mineral exploration?
Minerals like muscovite, illite, and sericite represent common hydrothermal alteration products found in mineralized zones and ore deposits. Their accurate identification using hyperspectral remote sensing has been challenging due to their similar spectral characteristics. Therefore, these minerals are often grouped together and referred to as 'white mica.' Understanding their composition is crucial, as it can reveal valuable information about the underlying mineralized system and indicate areas of interest for further exploration campaigns.
What controls the position of the 2200 nm combination feature?
The key diagnostic feature of white micas is an absorption feature that occurs at approximately 2200 nm. The precise position of this feature is controlled in part by the octahedral cation composition of the white mica, which is influenced by the geochemical properties of the causative fluids and host rocks. This spectral variation can serve as an indicator of alteration type, intensity, and fluid geochemistry, and can be a proxy for metal grade, offering valuable insights for exploration efficiency. The position of this 2200nm feature shows a relationship with the proximity to the mineralized zone and differs across different deposit types. Meyer et al., (2022) offers a review of the position of the white mica feature its relevance for the following mineral deposits: base metal sulfide, epithermal, porphyry, sedimentary rock hosted gold deposits, orogenic gold, iron oxide copper gold, and unconformity-related uranium.
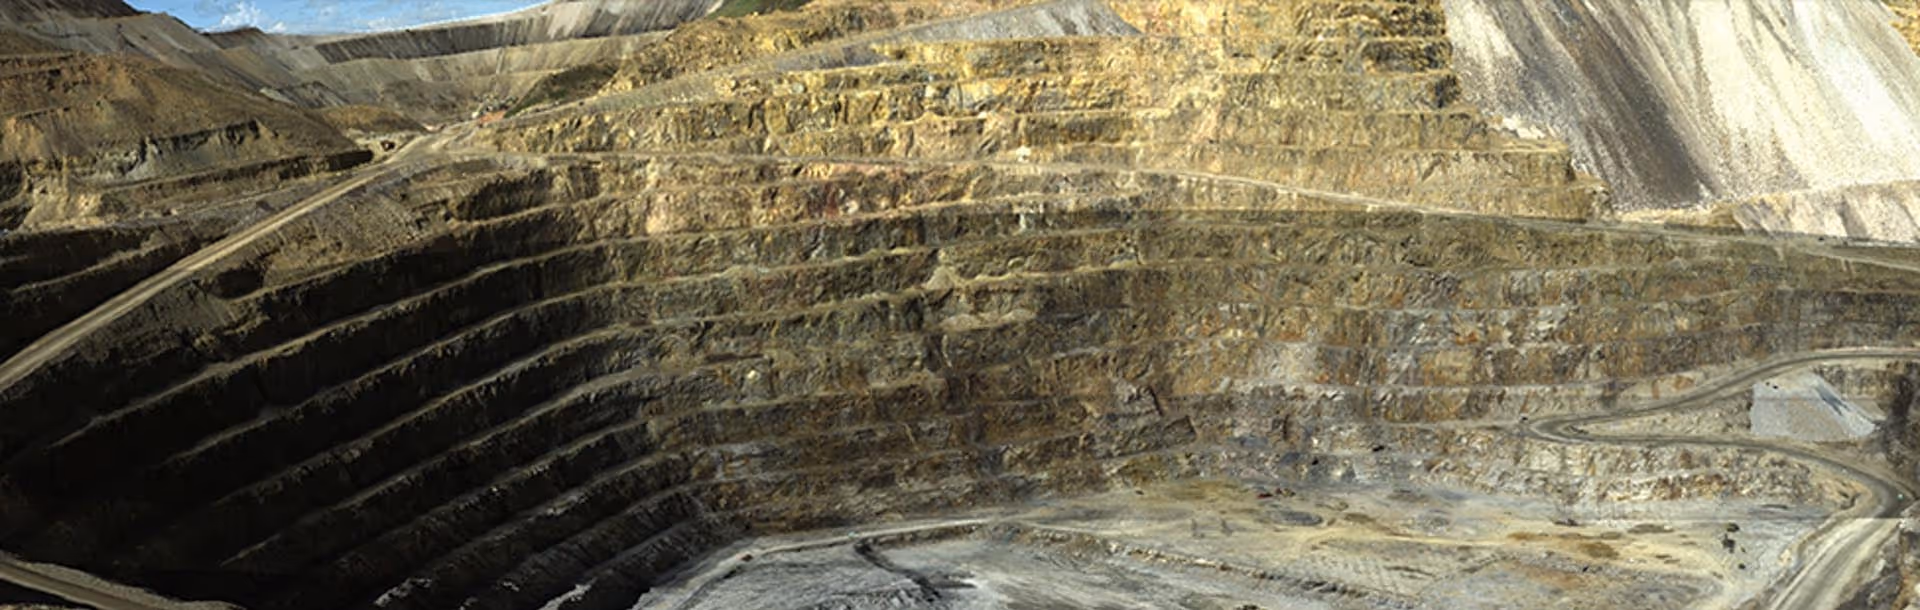
Mapping the extent and spatial distribution of this feature at a district-scale and the variation of its wavelength position is used to point out areas of interest for further exploration campaigns. Exemplary, HSI data was collected in the Cresson Pit at the Cripple Creek & Victor Mine in Cripple Creek, Colorado, USA by the U.S. Geological Survey in Sept. 20172. HySpex VNIR-1800 and SWIR-384 imaging data were collected in the open pit. Based on this, outcrop scale mineral maps were published to show variations in the position of the white mica 2200 nm combination feature and its relevance to mineralization patterns.
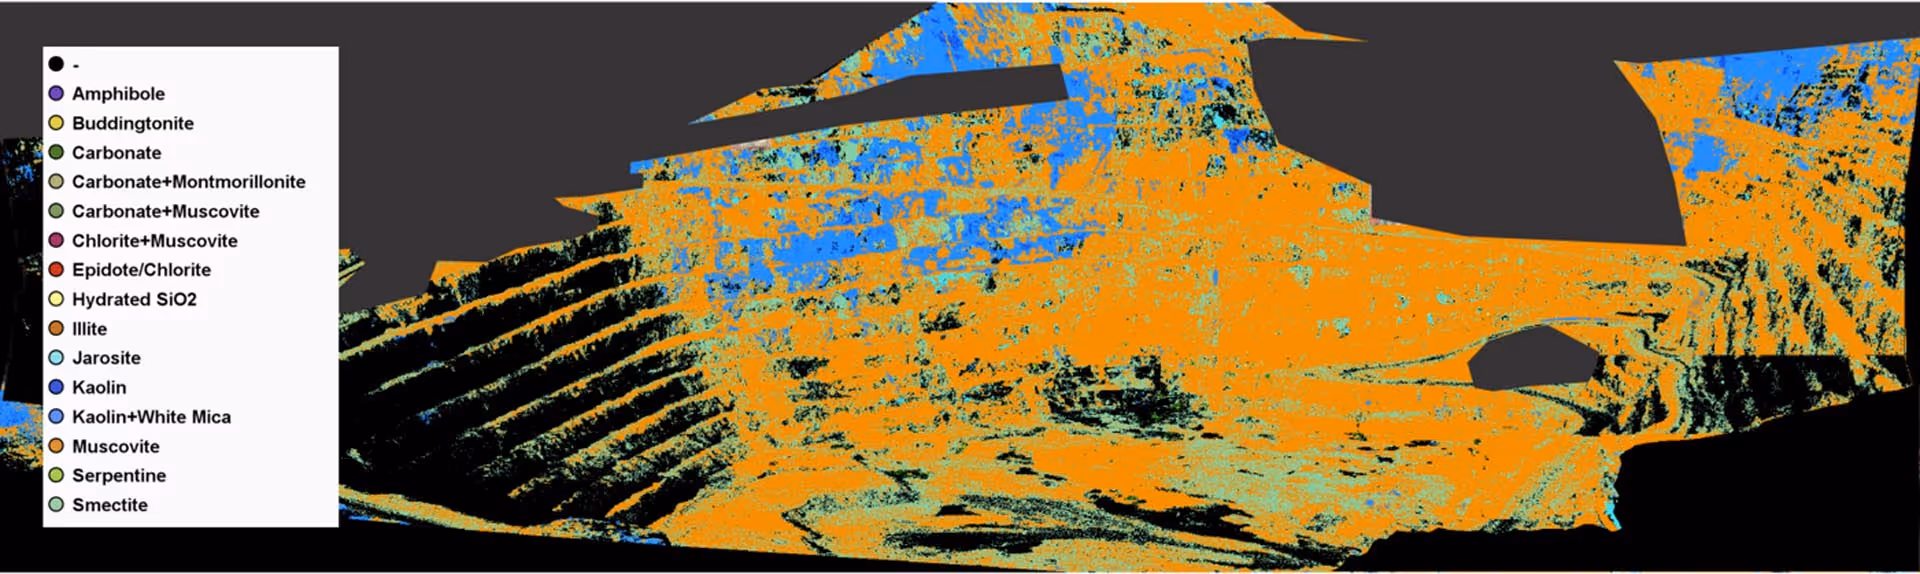
The mosaiced, reflectance data of the open pit (Figure 1, top) published in 2 was imported into the Breeze Geo Software from Prediktera. First, the integrated USGS MICA mineral mapping was applied (Figure 1, bottom) to identify areas dominated by white mica. Then the absorption feature minimum position was mapped via discrete wavelength positions to recreate the maps published by the USGS1 (Figure 2). A general trend towards longer wavelength positions (=lower AL content) is visible with increasing depth in the pit. This corresponds to the increased proximity to the Al-poor causative intrusion. The area scanned and mapped represents a vertical cross-section of a mineralized hydrothermal system.
.avif)
How can spectrometer quality and design influence the precise detection of this feature?
Many of the reviewed studies in [1] indicate that a shift of the wavelength position of this feature of 1nm is geologically relevant. A spectrometer being able to correctly detect this shift depends on a couple of factors that are investigated in a detailed sensitivity analysis for existing point and imaging spectrometers, including the HySpex SWIR 384, as well as theoretical spectrometers. The analysis focused on bandpass, sampling interval, channel position, and Signal-to-Noise Ratio (SNR). Spectrometers with narrow sampling intervals and bandpasses proved to be the most effective in accurately determining the feature position, with RMSEs of 1 nm achievable.
Does HySpex imaging spectrometers perform well in field studies?
Several imaging spectrometers exhibited high accuracy in capturing the white mica 2200nm combination feature when assuming a high SNR. The HySpex SWIR 384 was able to demonstrate RMSEs near 1 nm, making it a potential game-changer in field studies and exploration projects. The HySpex SWIR 384 imaging spectrometer’s effectiveness rivals that of point spectrometers, signifying its practical utility in the field of spectral geology and exploration*.Hyperspectral remote sensing has transformed the field of mineral exploration, enabling geologists to locate mineral deposits with unprecedented precision. The sensitivity analysis conducted in the here-discussed study offers valuable guidelines for spectrometer design, making mineral exploration more efficient and cost-effective. As technology continues to advance, spectral studies hold the potential to point to new, unknown mineral sources, providing crucial resources for sustainable development and contributing to our understanding of the planet's geological history. And we’re proud that HySpex cameras are right in the middle of it all and have been field-tested and proven by geological surveys, miners, and in mineral research all over the world.
*among few other imagers identified in 1
- John M. Meyer, Raymond F. Kokaly, Elizabeth Holley, Hyperspectral remote sensing of white mica: A review of imaging and point-based spectrometer studies for mineral resources, with spectrometer design considerations, Remote Sensing of Environment, Volume275, 2022,113000, ISSN 0034-4257, https://doi.org/10.1016/j.rse.2022.113000.
- HySpex by NEO VNIR-1800 and SWIR-384 imaging spectrometer radiance and reflectance data, with associated ASD FieldSpec® calibration data, collected at Cripple Creek Victor mine, Cripple Creek, Colorado, 2017, https://doi.org/10.5066/P92VF8HP.
- Title image based on data published in 2


