Data Quality
In this post, we would like to share some performance parameters of our Mjolnir VS-620 for UAV, field and airborne applications. We recently also designed a 1m lens for lab applications.
In this post, we would like to share some performance parameters of our Mjolnir VS-620 for UAV, field and airborne applications. We recently also designed a 1m lens for lab applications.
In the past we have published an article about data quality from UAV applications, covering topics like; operating it correctly to the importance of having sharp optics: Scientific Grade Quality from UAVs
In this article, we will show you the measured key quality parameters of the VS-620 system. In the table below we list the top-level specifications of the VS-620.
| Specification | HySpex Mjolnir VS-620 |
|---|---|
| Spectral range | 400-1000 nm |
| Spectral sampl. (nm) | 3.0 | 5.1 |
| Spatial pixels | 620 |
| Spectral channels | 490 |
| Field of view (deg) | 20 |
| Pixel FOV (mrad) | 0.54/0.54 |
| Bit resolution (raw data) | 16 |
| Noise floor (e-) | 2.34| 80 |
| Dynamic range | 4400 | 10000 |
| Peak SNR | <180 | <900 |
| Max speed (fps) | 100 |
| Power cons. (W) | 50 (with DAU/INS) |
| Dimensions (cm) | 37.4 - 20 - 17.8 |
| Weight (kg) | 6.0 |
The table above actually does not tell you anything about how sharp your optics are relative to the pixels and bands. That’s why in this article we will show the actual optical performance of the VS-620 data product. All plots below are taken out of the test reports that we deliver with every system.
SWIR detectors are usually very expensive and have a limited amount of pixel relative to the VNIR range. This is one of the reasons why its especially important to gather as much information as possible per pixel in this spectral range. Below we show the measured FWHM of the point spread function across the track and for all wavelengths.
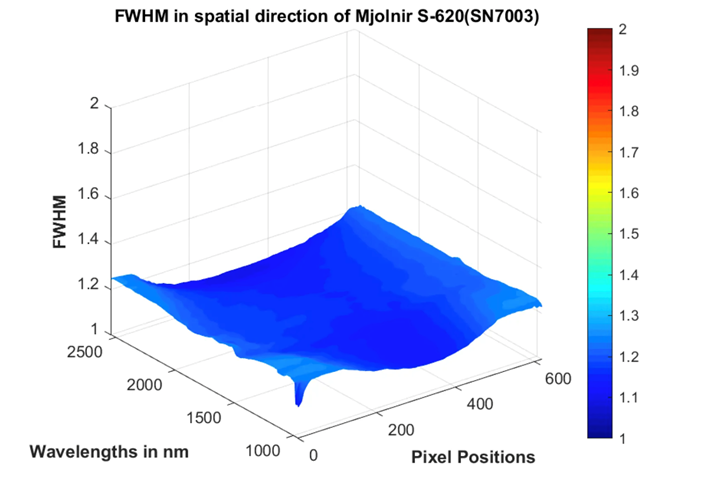
Figure 1FWHM of point source as a function of FOV and wavelength.
When we measure FWHM of such sharp systems we use the trapezoidal approximation of the FWHM, this is a very pessimistic way of measuring it, so in real life, the actual FWHM is even better than the plots.
As a conclusion for the S-620, the FWHM is sharper than 1.3 pixels everywhere in the FOV and for all bands.
In the plot below we show the FWHM of the spatial PSF of the V-1240.
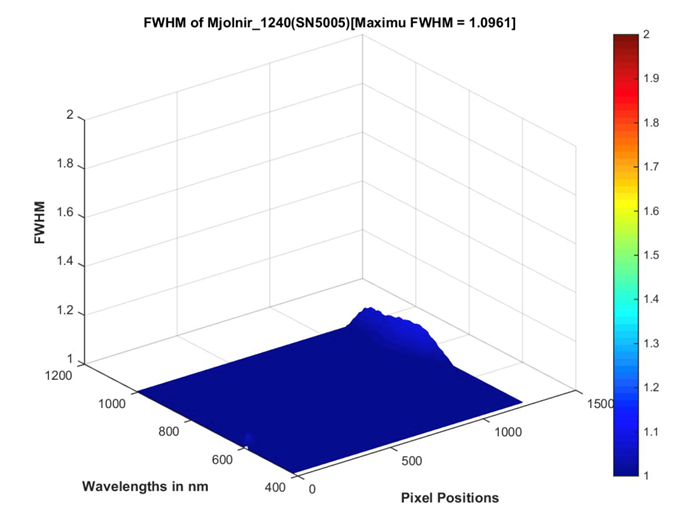
Figure 1FWHM of point source as a function of wavelength.
The conclusion for the V-1240 is that this is also extremely sharp per pixel everywhere in the FOV and for the whole spectral range.
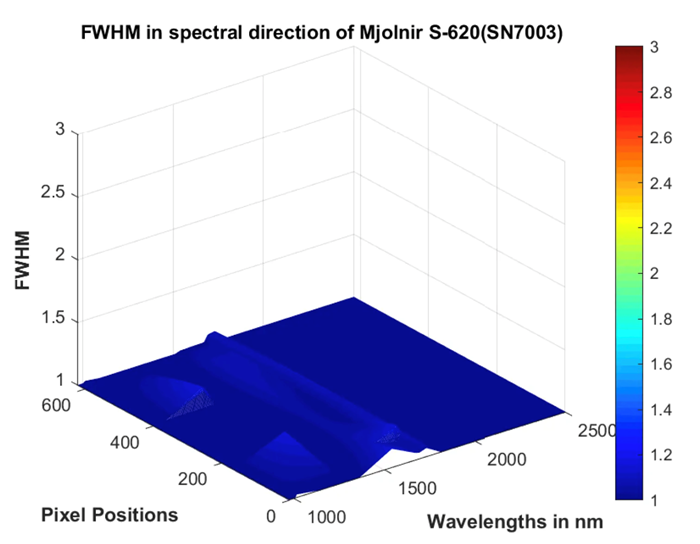
In the specifications, you can see the number of bands in each camera module. To know more about how sharp spectral features the imaging spectrometer can resolve you need information about the spectral resolution (sharpness). To measure this, we calculate the FWHM of the spectral PSF for sharp spectral sources. The graph below shows the spectral FWHM for 12 narrow band sources across the spectral range for the S-620.

The graph below shows the spectral FWHM for 23 narrow band sources across the spectral range for the V-1240.
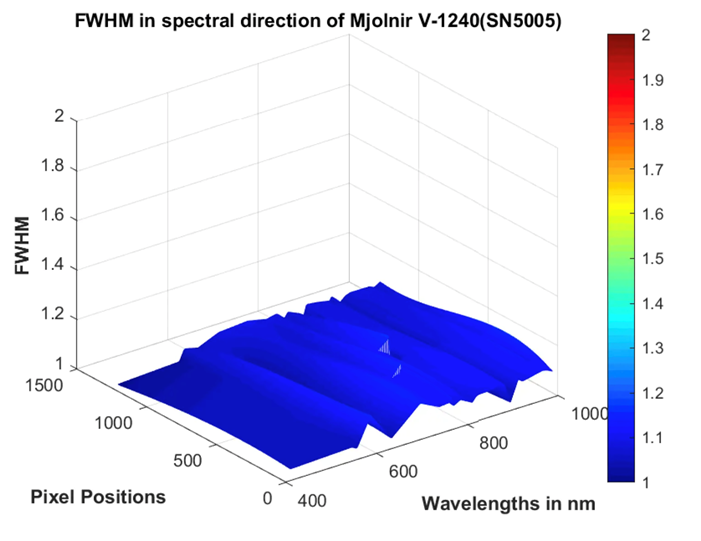
V-1240 and S-620 are very sharp per band for all wavelengths and across the FOV.
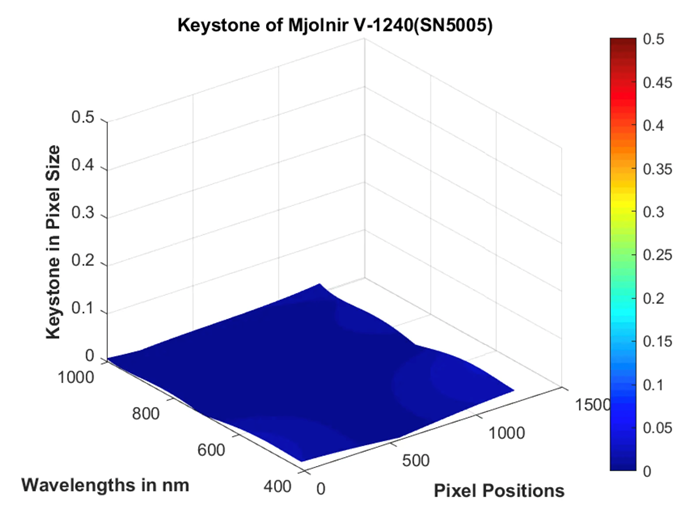
As explained in one of our previous articles on LinkedIn; The keystone specification of any hyperspectral system is one of the most important parameters defining its usability as an imaging spectrometer. However, it is also the most overlooked parameter during the selection phase (to read more: Keystone Effect)
The keystone effect in the S-620 is shown below. To measure keystone we scan a point source, at infinity, through the whole FOV of the camera with steps of 1/100 of a pixel.
The S-620 has less than 5% of a pixel keystone everywhere in the FOV.
Below you can also see that the V-1240 have extremely low keystone values as well.
To measure the smile we use the same narrow band spectral sources as for the measurements for the spectral resolution. In the VS-620 data every band has one center-wavelength, the smile tells you how much the center of gravity of a spectral source would vary across the whole FOV. Below you see this curve for the 12 narrow band sources for the S-620.
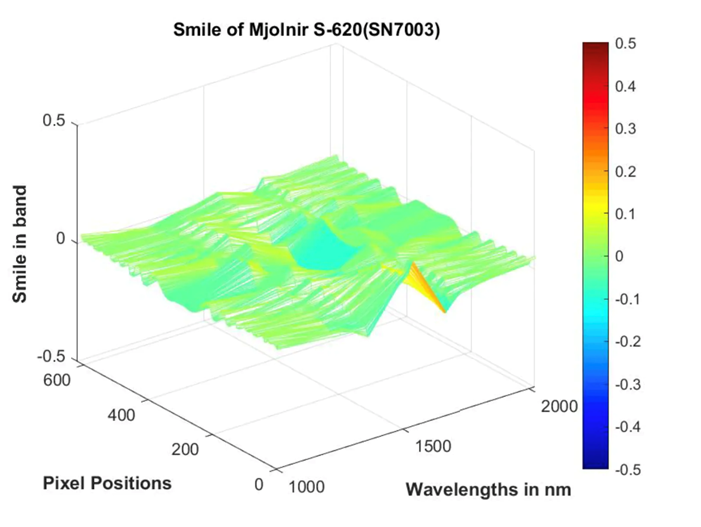
This graph shows that you have less than 10% smile everywhere in the FOV for the S-620.
The graph below shows the smile for the 23 narrow band sources for the V-1240.
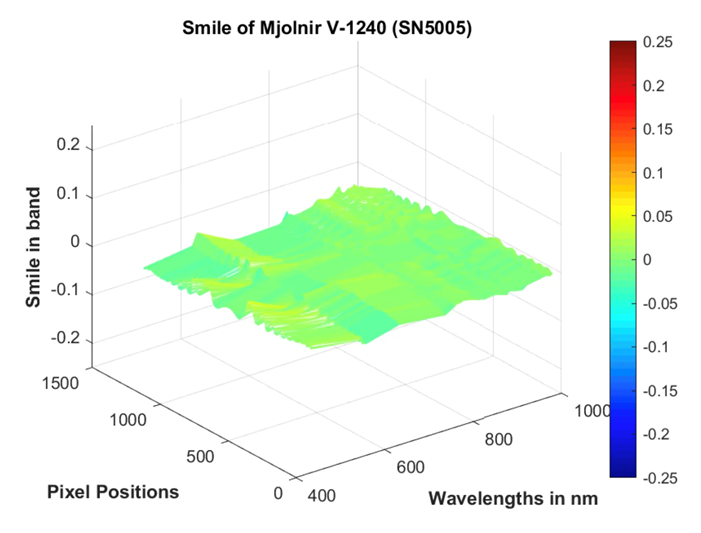
The V-1240 also show very small smile distortions (less than 10% of a band).
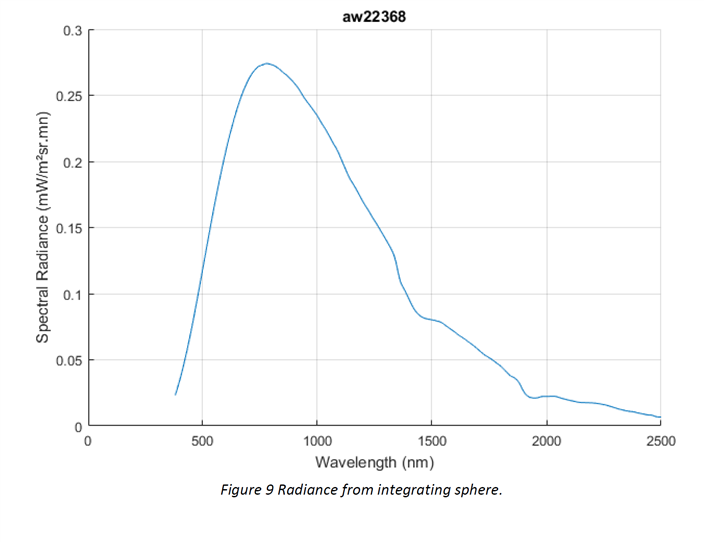
When designing a small UAV camera you would typically use a compact camera/detector in the imaging spectrometer. To get as many spatial pixels and spectral bands as possible you would typically select a detector with small pixel pitch. In the V-1240 we use a very good detector with 3.45um pixel pitch and in the S-620 we use the first-ever 10um pixel pitch MCT detector with exceptional performance. Smaller pixel pitch means smaller full well witch again means smaller peak SNR. Even with this small pixel pitch, the Mjolnir systems give you impressive SNR values. The S-620 have F1.9 optics while the V-1240 has F1.8 optics, this makes the Mjolnir very light sensitive as well. The SNR values will be given for the following incoming radiance:
The SNR values for S-620 without any binning (620 x 300) is shown below.
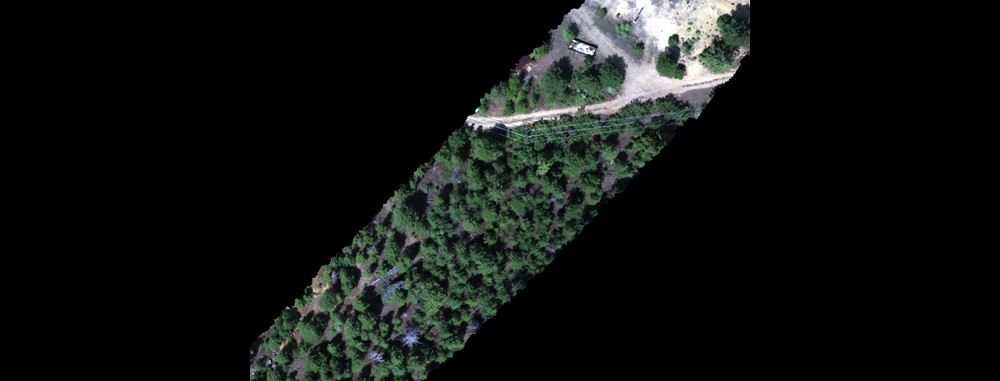
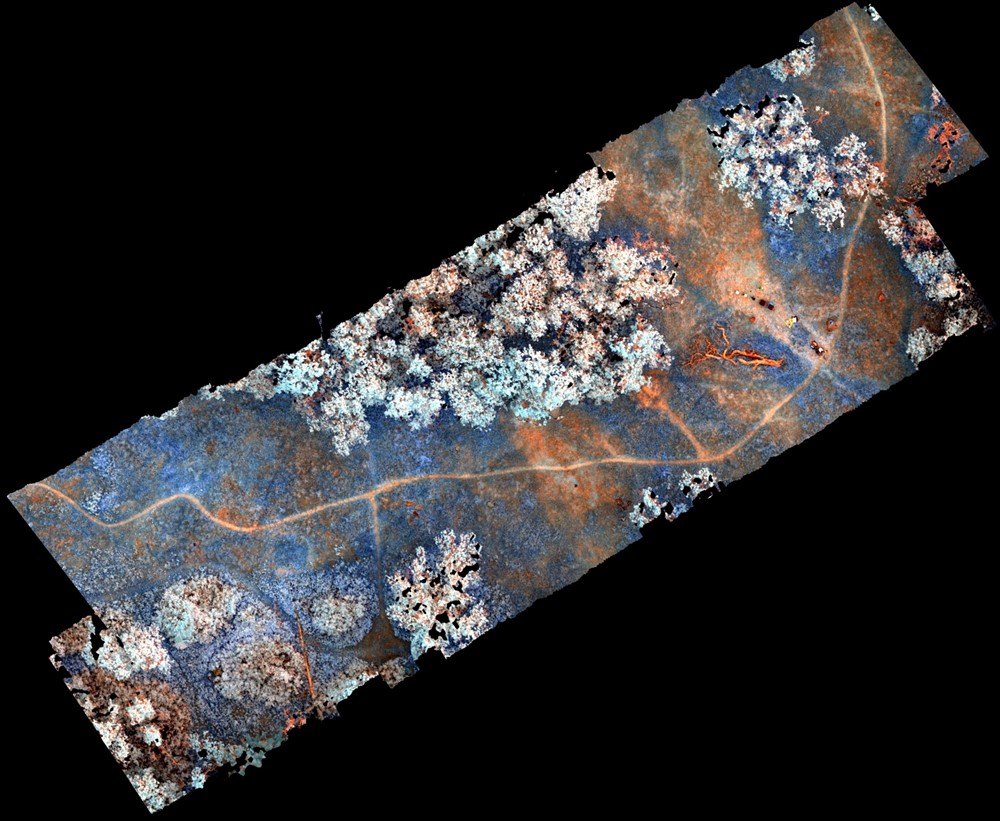
The camera above is one of our demo units (SN5005 and SN7003). Since the first public demonstration during the EARSeL conference in Brno (Mjolnir at EASRSeL) this system has been going from one UAV campaign to the other, around the world. If you want us to come and do a demo at your site or if you are interested in any of the demo data that we have acquired, please contact us. Here is an example of 3 flight areas from the VS-620. They are georeferenced in PARGE, developed by RESE. The system is boresight calibrated. Below you can see some false-color RGB previews from some of our demos.
Preview from Canada using a Digital Surface Model (DSM) with 2cm accuracy so we got better than 1 pixel matching in the overlapping regions between the parallel lines using Direct Georeferencing with no GCPs on the ground. (Nearest Neighbor resampling)
Another preview from Canada (Nearest Neighbor resampling):
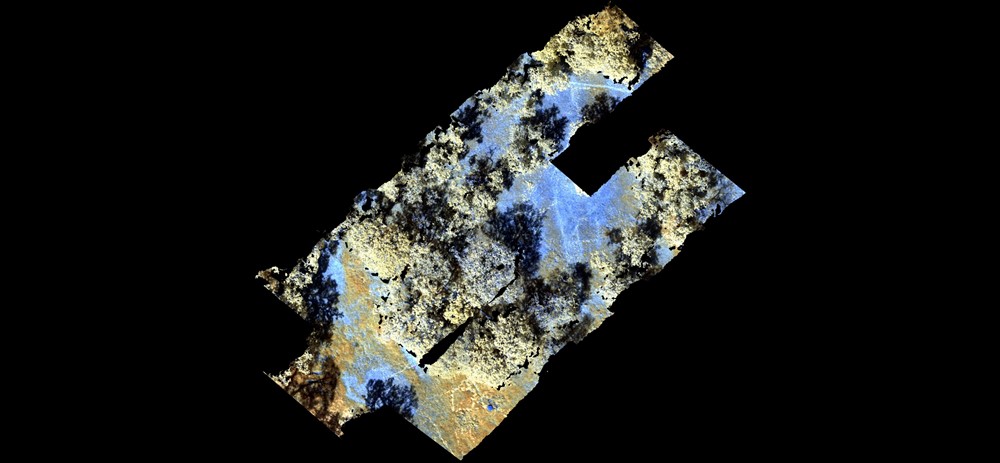
Preview from Denver using a 1m DEM (Nearest Neighbor resampling):