Process and end-product control of pharmaceuticals with hyperspectral imaging


Hyperspectral imaging is a powerful tool to detect the concentration and distribution of different chemical components in mixes. In pharmaceutical tablets, there are typically one or more active ingredients (API) mixed with several pharmaceutical excipients including fillers, binders, disintegrants, lubricants, glidants, flavours and colors. Detailed control of the mixing ratios is critical not only to secure correct API dosage, but also for correct delivery and absorptivity in the body. It is also critical to achieve homogenous mixing of the components to secure that all tablets in a production are the same. For tablets that are produced with the purpose of being split in two or four, there is even a requirement for homogeneity within tablets.
In this example, one API is mixed at different ratios with three different excipients of similar characteristics.
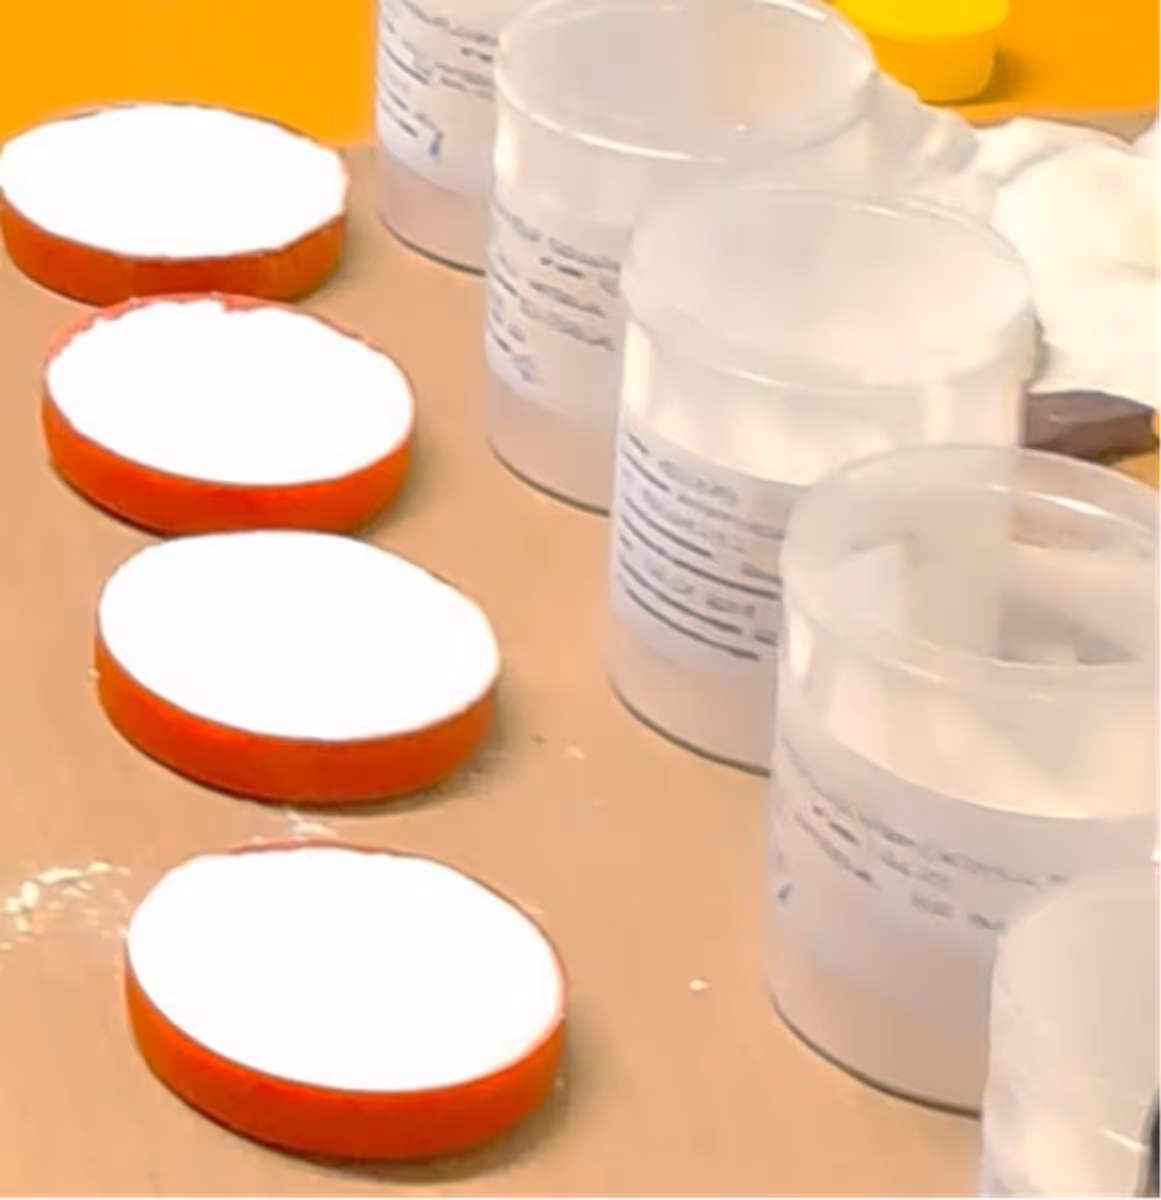
The four pure samples, two unknown powder mixes and one set of pharmaceutical pills also containing a mix of the same components were imaged using a HySpex SWIR-384 hyperspectral camera.
The data was analyzed to evaluate the amount and distribution of API in the mixes and pills.
Although all the substances appear identical in the visible range, they all show spectral structure in the SWIR spectral region. The API signature is particularly easy to distinguish due to its unique absorption features. The spectral differences between the pharmaceutical excipients are smaller, as expected from components with similar chemical structure.
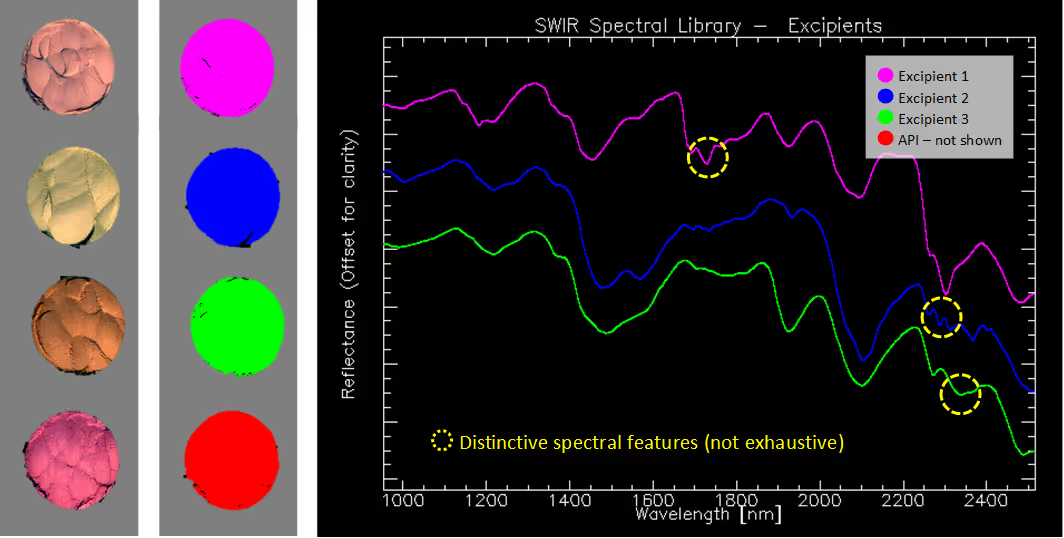
The high spectral resolution and low smile effect** characteristic of the HySpex cameras ensure that we accurately capture the sharp peaks of the API and achieve a consistent separation of the spectrally similar excipients. The data from the pure samples was used to create a library of spectral references. With the spectral unmixing capability in Breeze analysis software from Prediktera, we can quantify the ratio of the different components in the mixes using the spectral library as input. This spectral unmixing function allows for solving quantification problems without the need of a comprehensive calibration set.
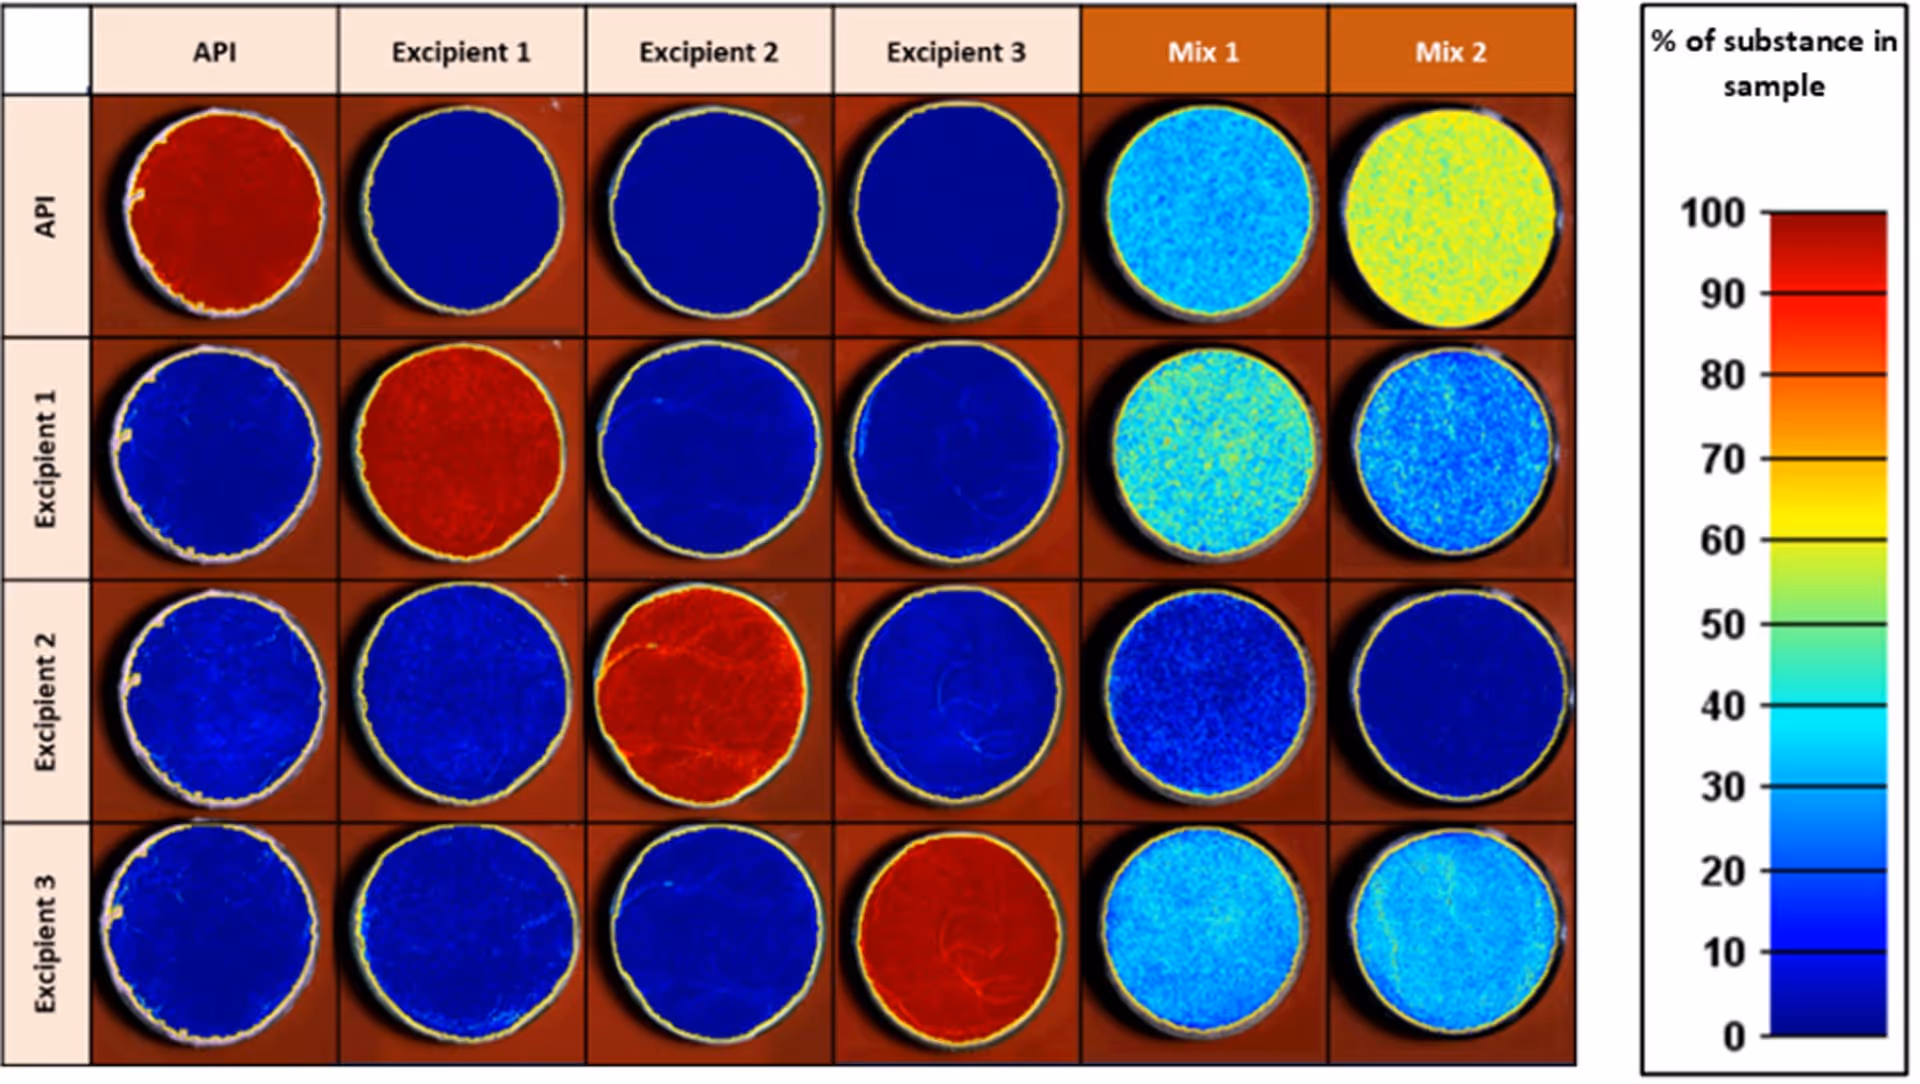
Spatial distribution of the different chemical substances in the pure samples and in the two unknown mixes.
The calculation is based on spectral unmixing applied to each pixel in the image. The color-coding gives an estimation of the amount of each substance on a given sample, and the amount of API in the mixes.
Hyperspectral images of all sample powders and pills were acquired using a HySpex SWIR-384. The camera operates in the 930-2500 nm spectral region with a spectral sampling of 5.5 nm. The camera has 384 spatial pixels and can achieve resolutions of 52 µm. The sensor acquires images at speeds compatible with most transport and sorting systems and can be used for real-time analysis.

The example shows that hyperspectral imaging is a good choice for process and end-product control of pharmaceuticals giving detailed information about both concentrations and distributions simultaneously. It also shows that this type of application benefits from high resolution and image quality. The method allows for continuous non-destructive monitoring of the whole production volume as opposed to the standard method of random sampling for laboratory analysis.
Contact us to discuss your application and requirements with our specialists.


