Prediktera Software


A complete toolset
.avif)
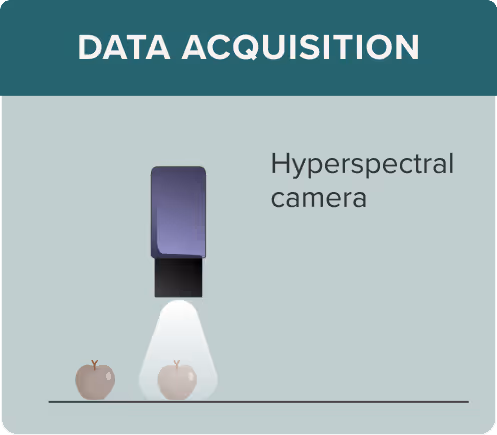
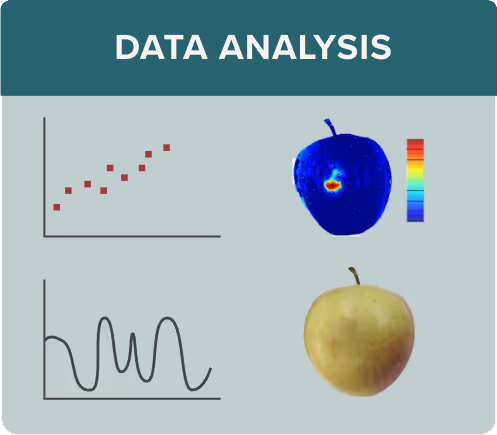
Lab & Field
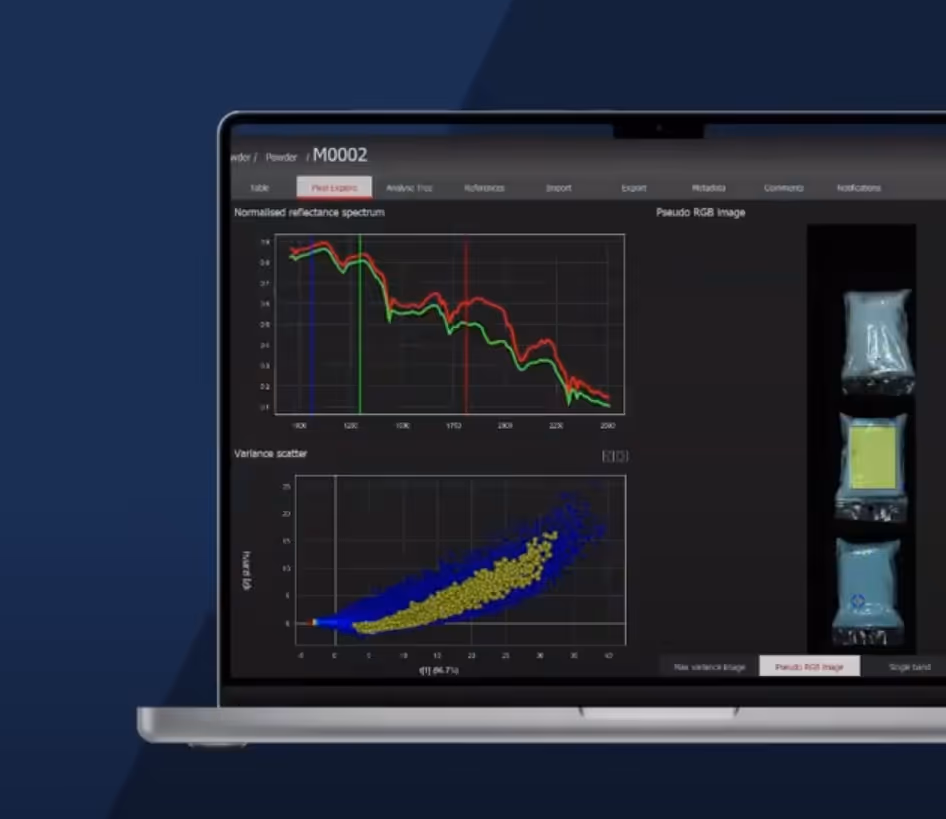
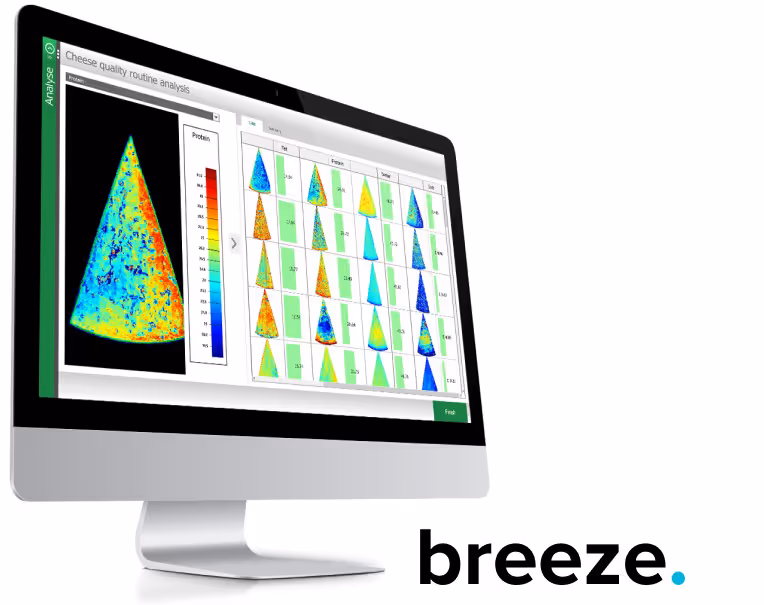
Breeze
Breeze is Prediktera's premiere software solution enabling a wide range of hyperspectral imaging applications. It is used in research, application development, routine analysis and easily extends into real-time industrial solutions.
- Speed up research and development of applications
- User friendly interface for experts and beginners
- For R&D and for real-time analysis
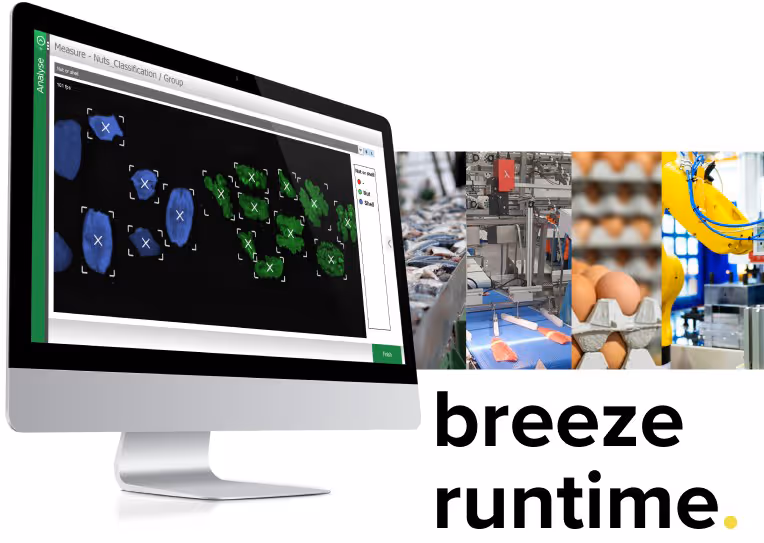
Industrial integration
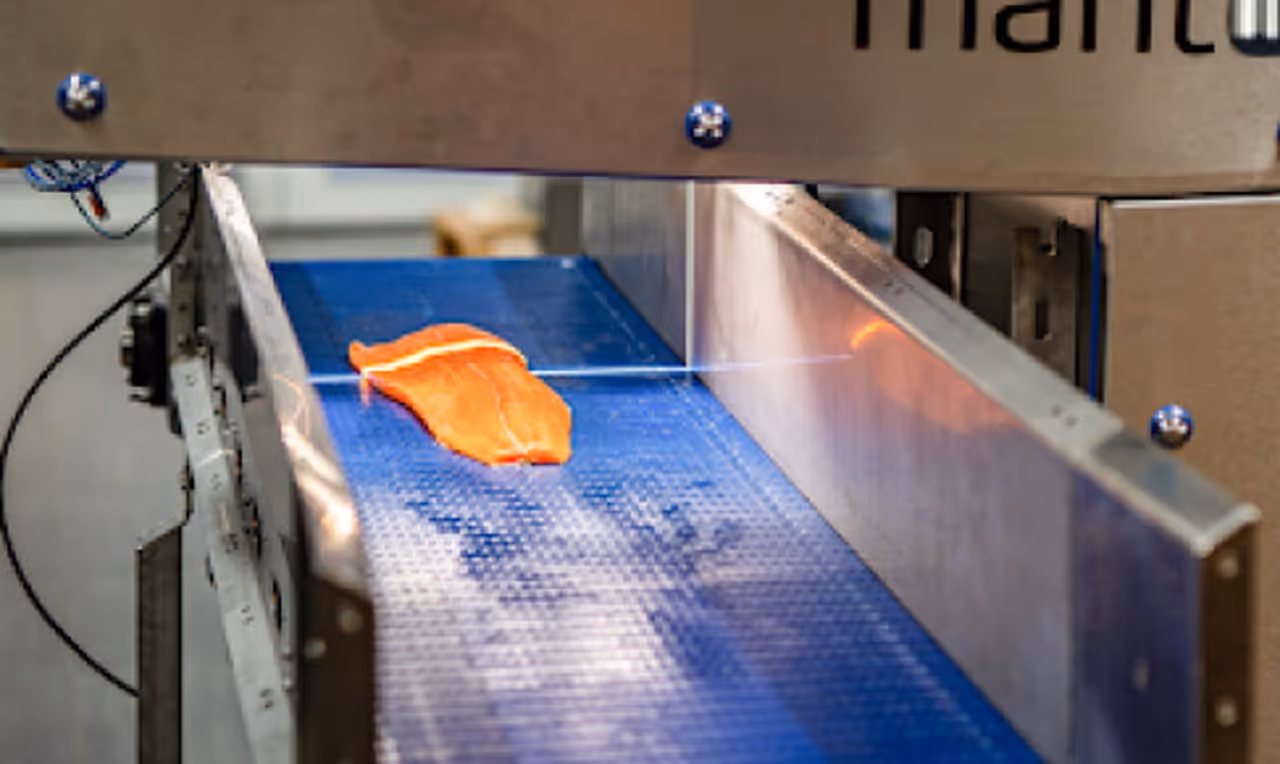
Breeze Runtime
Breeze Runtime makes it easy to implement hyperspectral image analysis into existing systems and processes. Breeze Runtime enables real-time chemical quantification, classification and object identification of materials being scanned on-line in process.
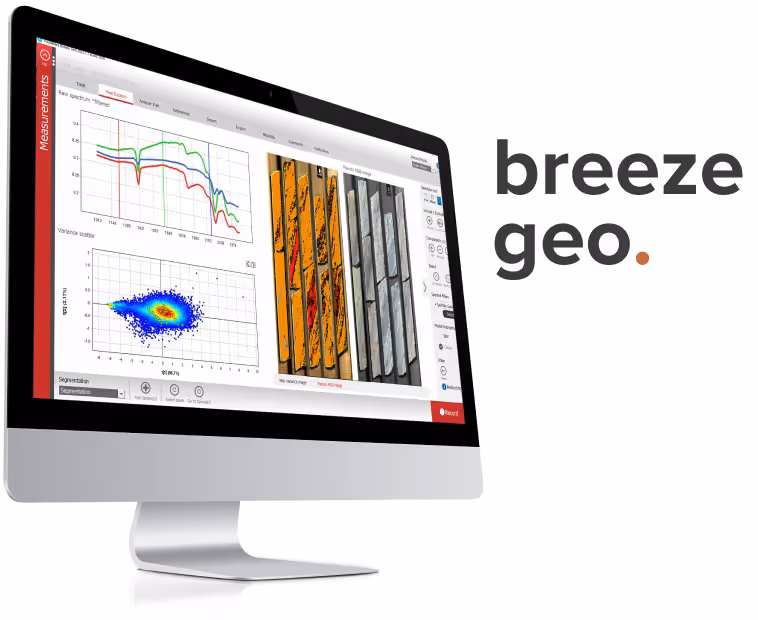
Geology
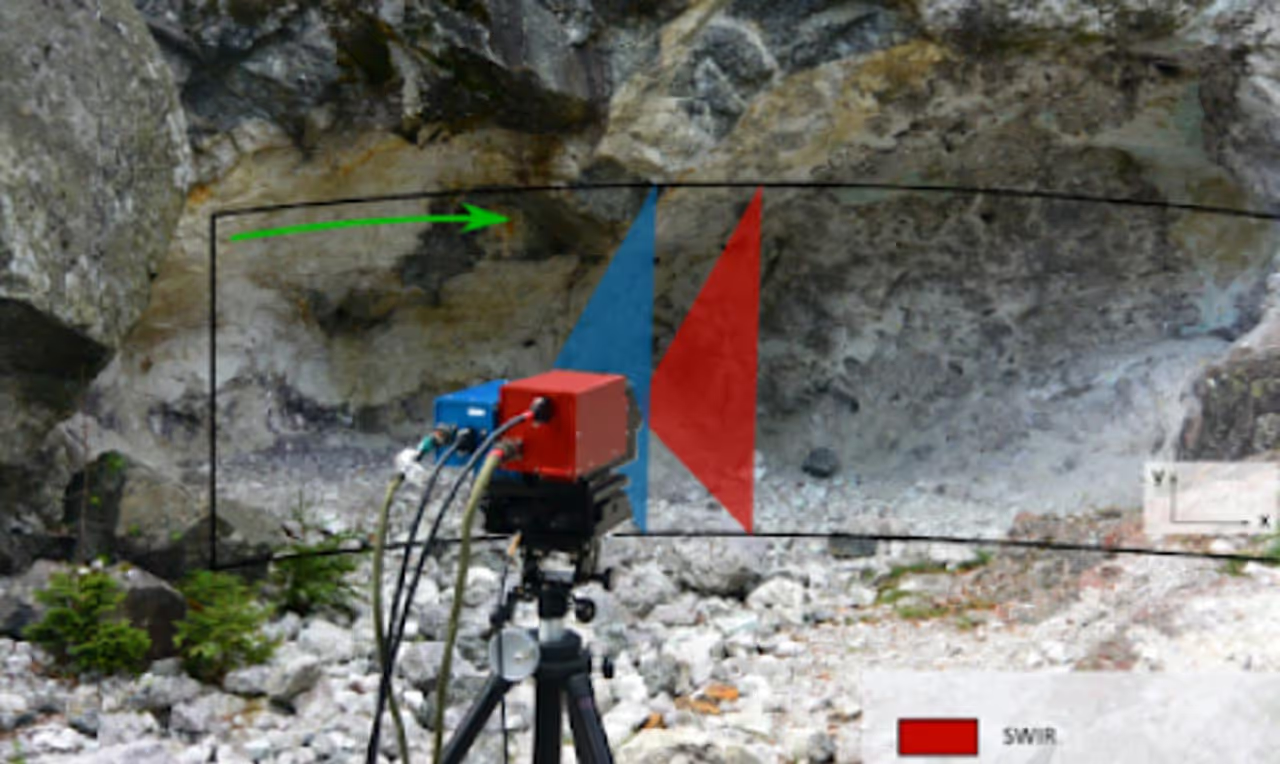
Breeze Geo
Breeze Geo provides an all-in-one solution that covers every step from data acquisition and analysis to logging and exporting of mineralogic interpretations. Breeze Geo includes several efficient algorithms and modelling techniques allowing for advanced exploration and interpretation of the data. The software comes tihe built-in spectral library of a wide range of mineral. Additionally, you have the option to create your own custom library.


